The Risk of Curve Yield Inversion
(small thread 🧵)
A yield curve is simply a line that connects the yields, or interest rates, of bonds that have different maturity dates.
Short-term bonds, like the 2-year Treasury, usually reflect expectations of future Fed interest rates, while long-term bonds, like the 10-year Treasuries, reflect future inflation rate expectations.
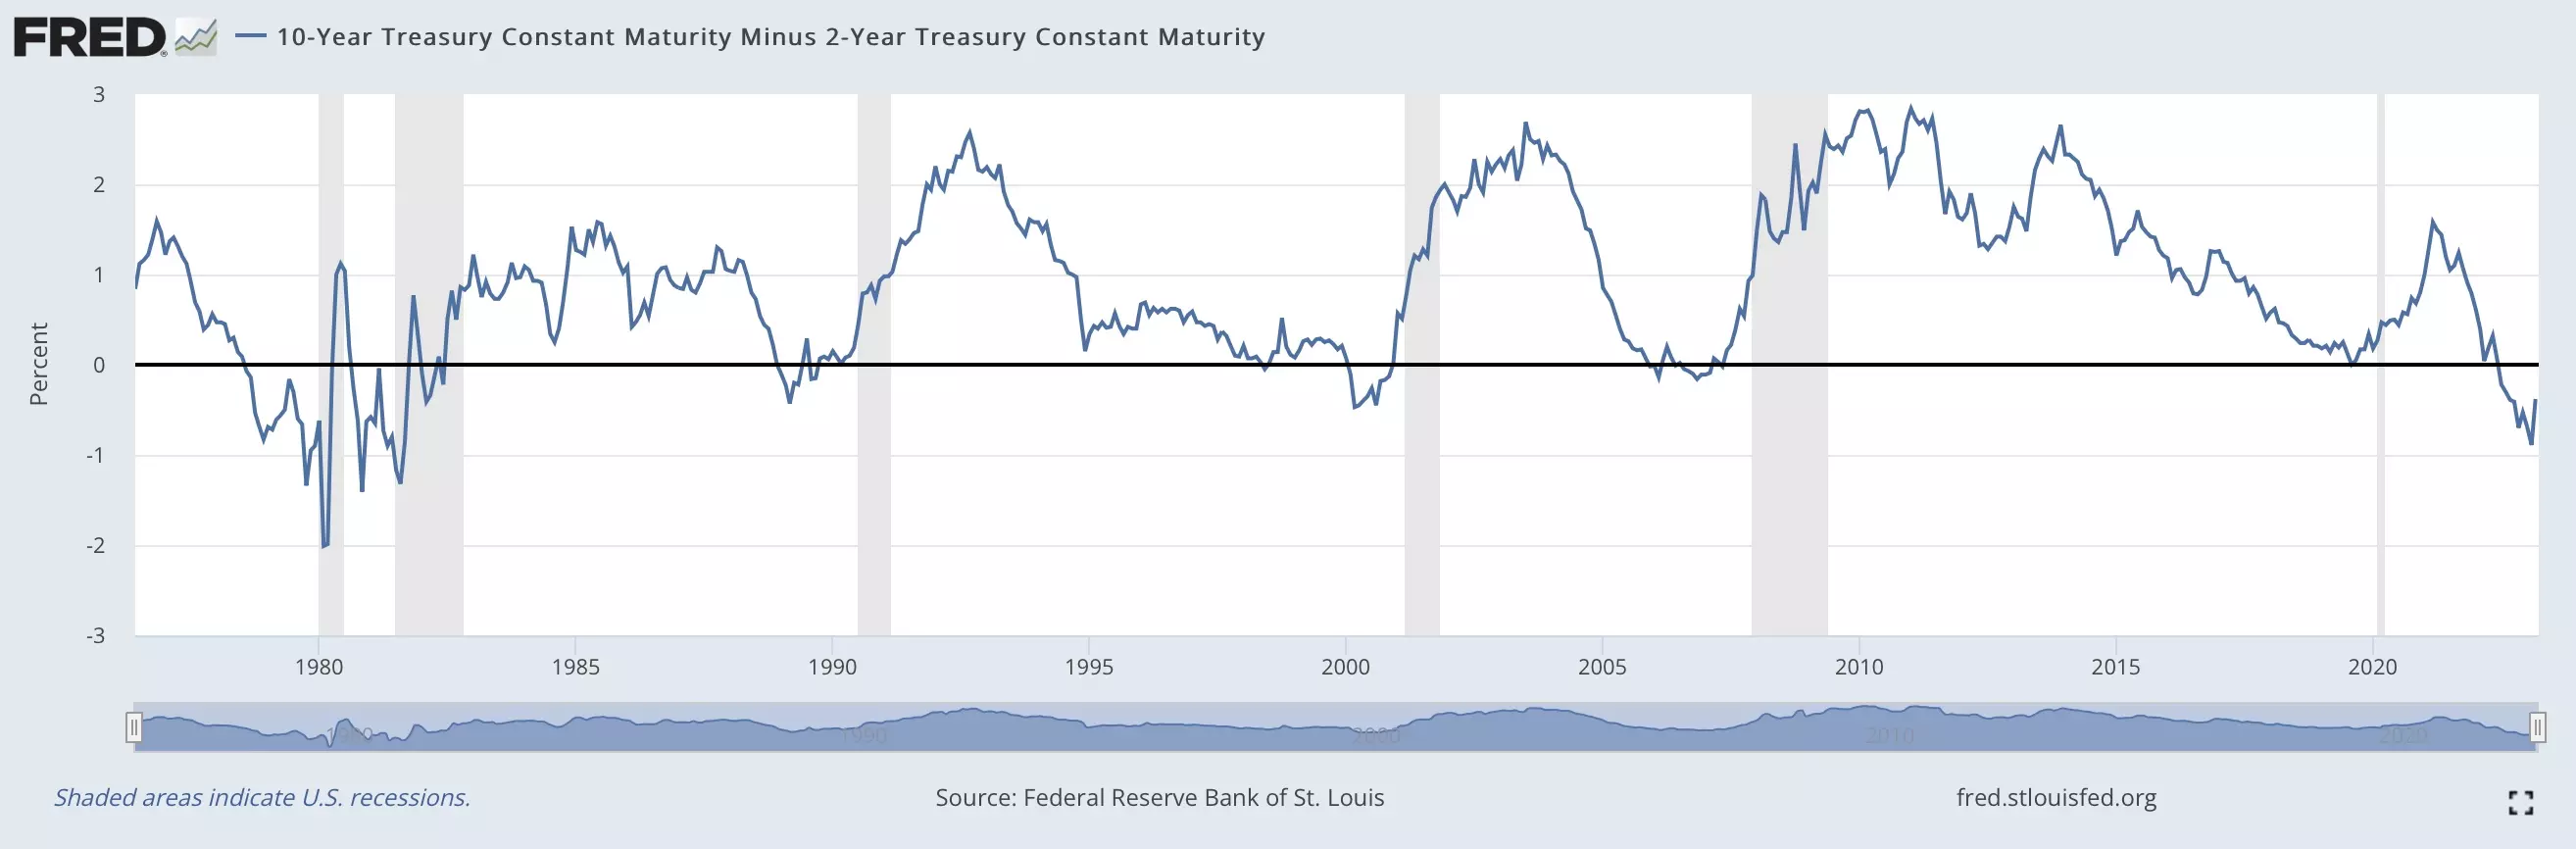
A great indicator that suggests bad times ahead is the Curve Yield Inversion. That arrives when the spread between the 10-year Treasury Bond and the 2-year Treasury Bond is negative. Usually it means a recession, deceleration, crisis or whatever you called it is coming in 1-2 years.
Look at this link below:

10-Year Treasury Constant Maturity Minus 2-Year Treasury Constant Maturity
The 10-year minus 2-year Treasury (constant maturity) yields: Positive values may imply future growth, negative values may imply economic downturns.
In this other video there is some correlation between FED rates, stock market, recession and even Bitcoin.
https://twitter.com/ColinTCrypto/status/1639293045383262210?s=20
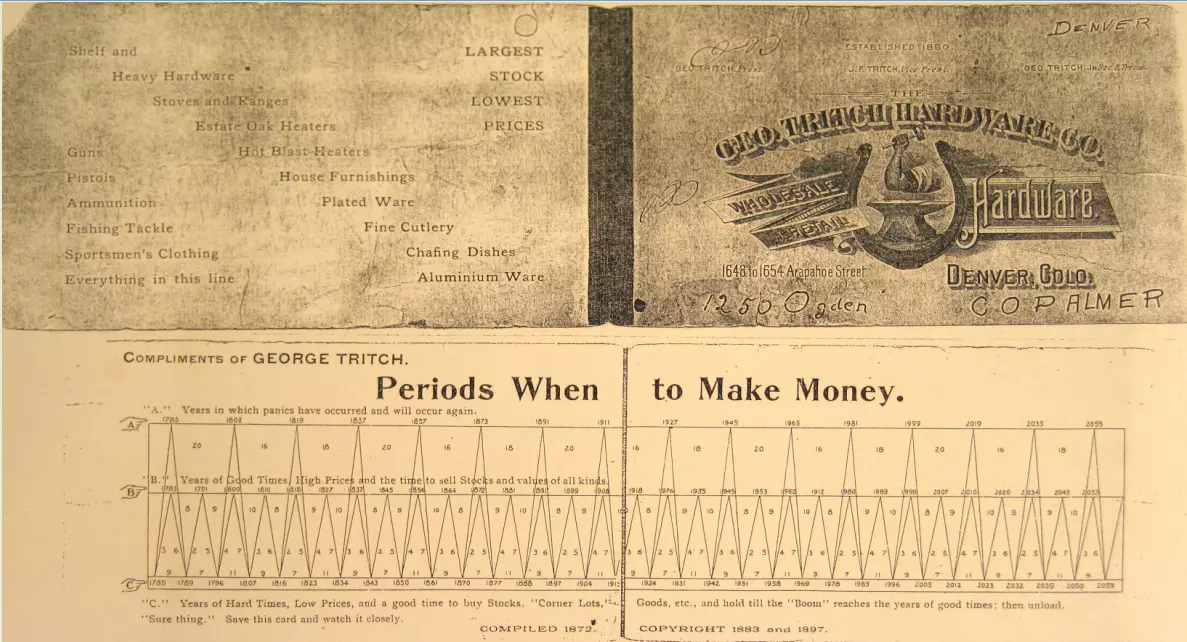
Finally, at last picture we see the "Periods When To Make Money", created at 1892. (2023 bottom year)
#FED #rates #recession #bonds