If you don’t own any Bitcoin, this might be the most important post you’ll read this year.
Some people feel Bitcoin price modeling is a bit like astrology, but I disagree. Some people are devoted to a particular price model while others hate a particular price model…both are stupid things to do.
The reality is this: all models have a measurable degree of utility and no model will be perfectly useful.
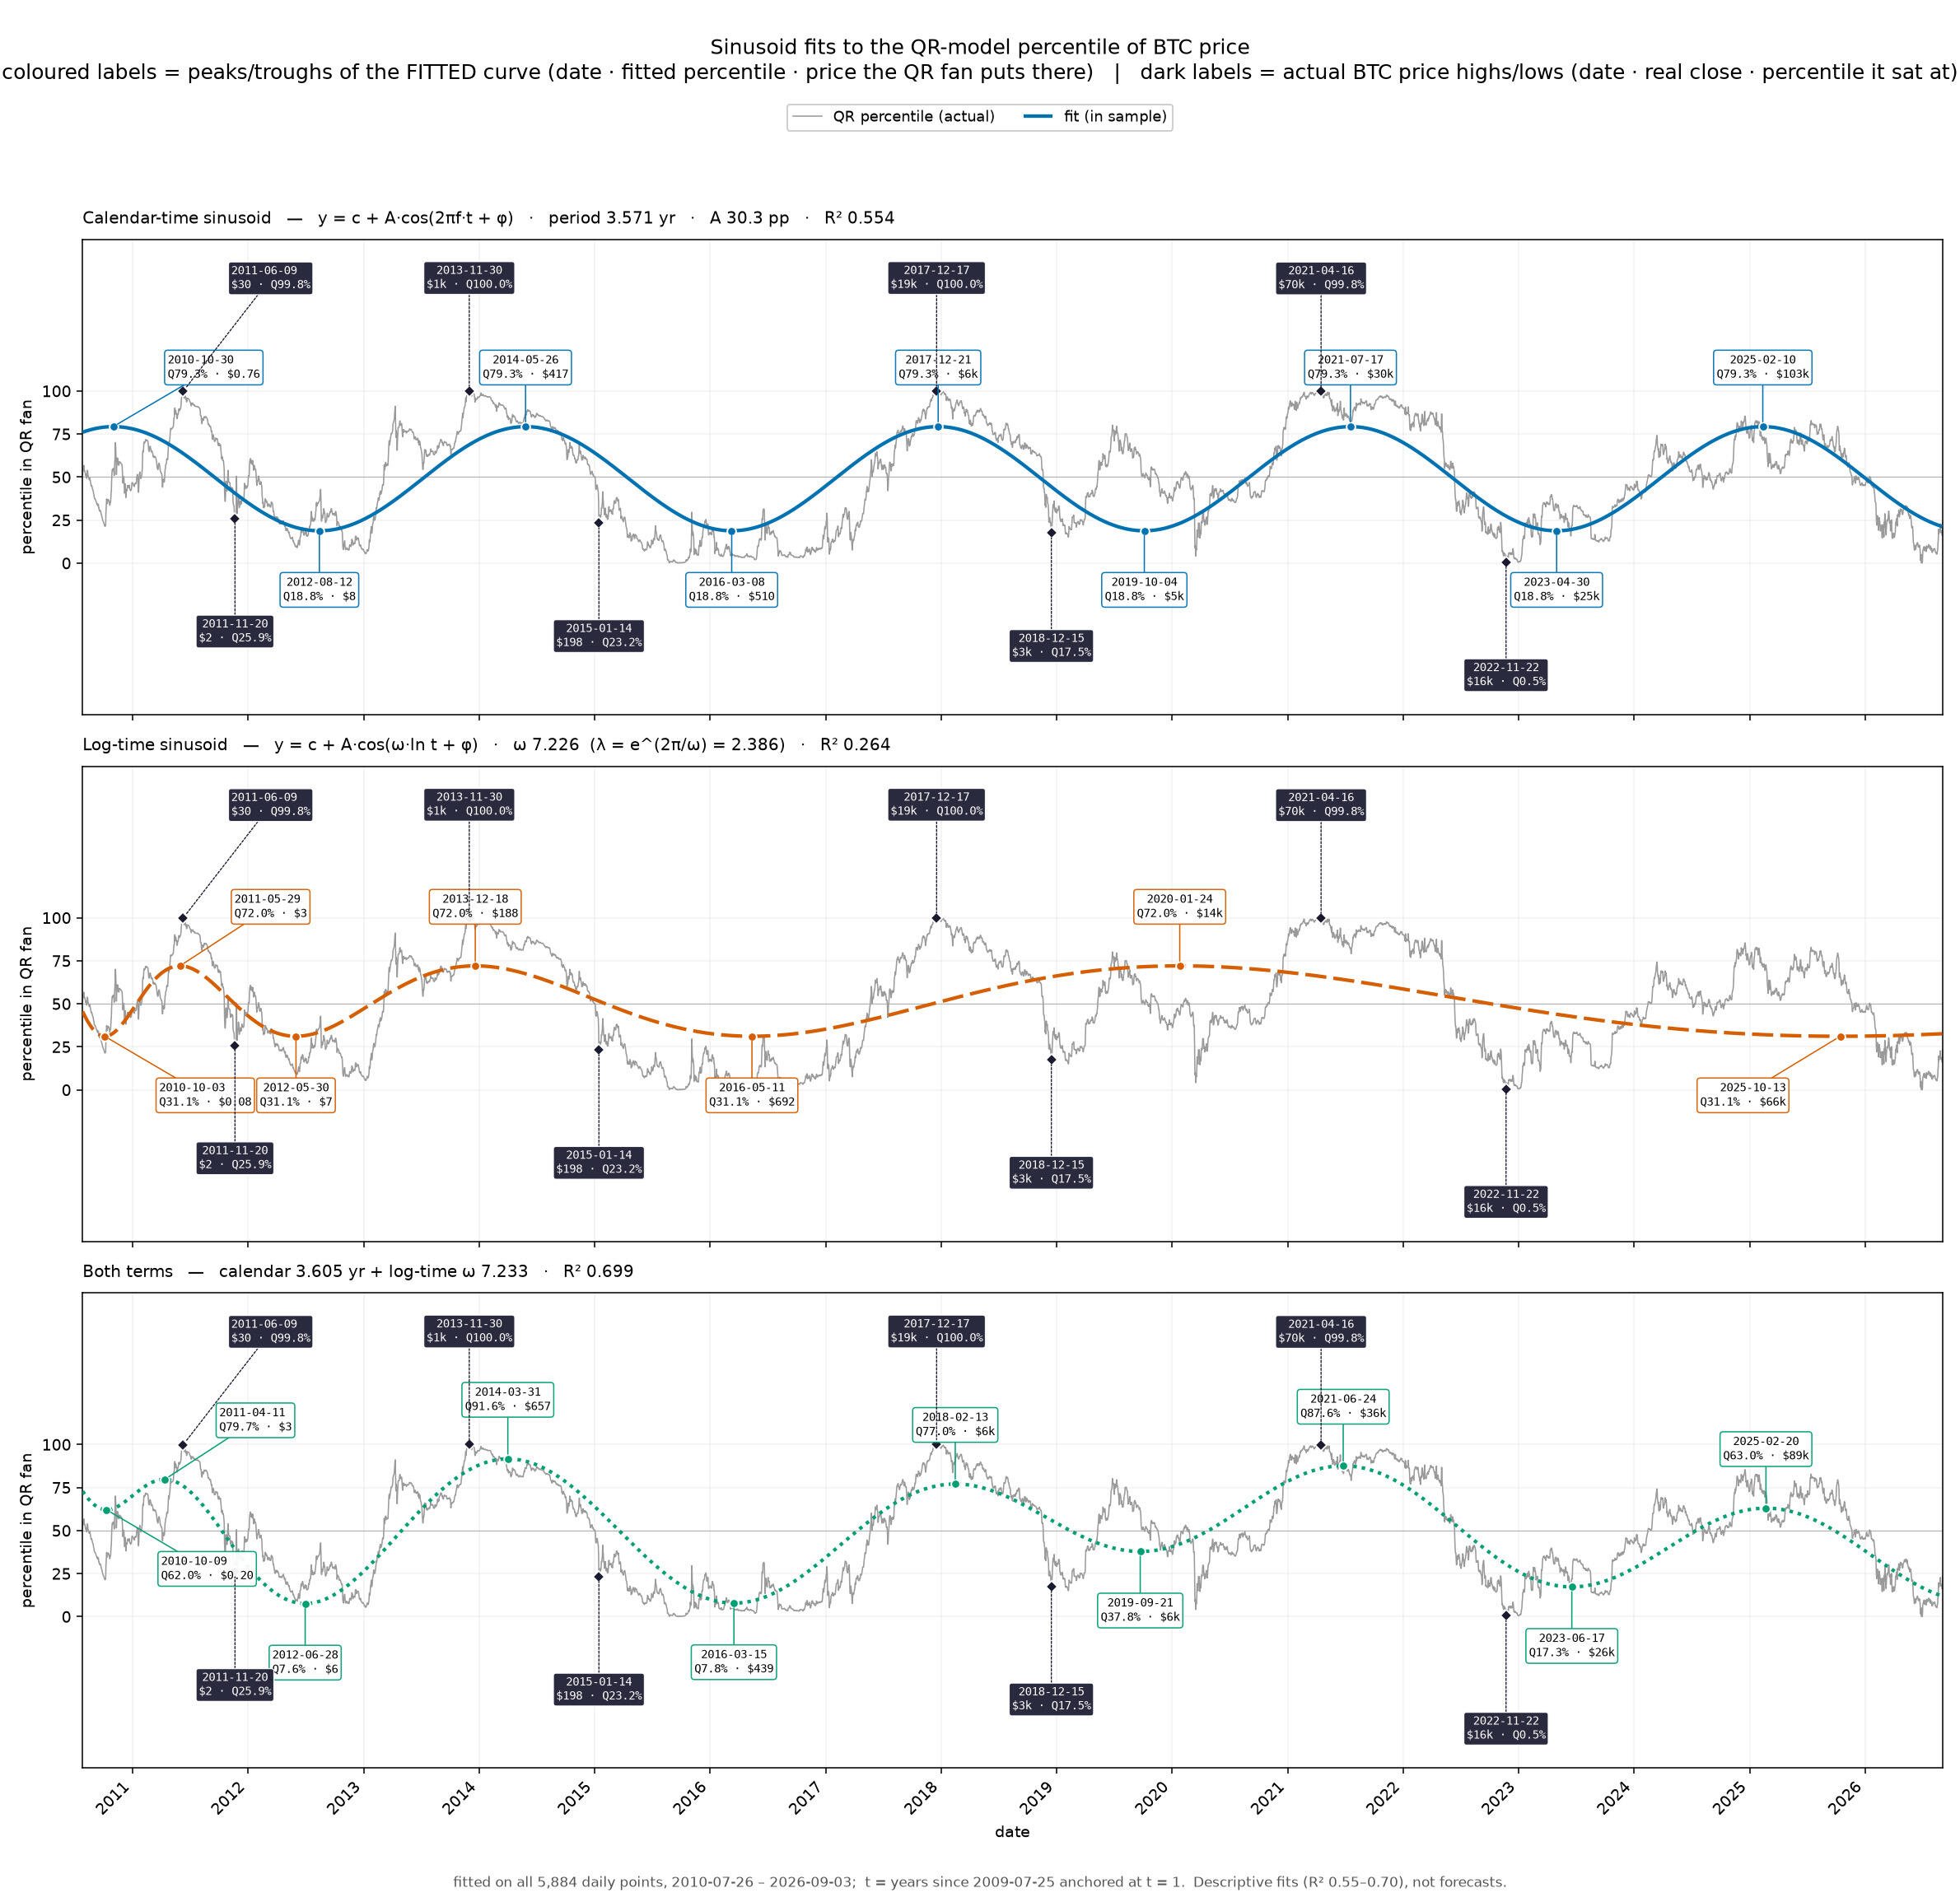
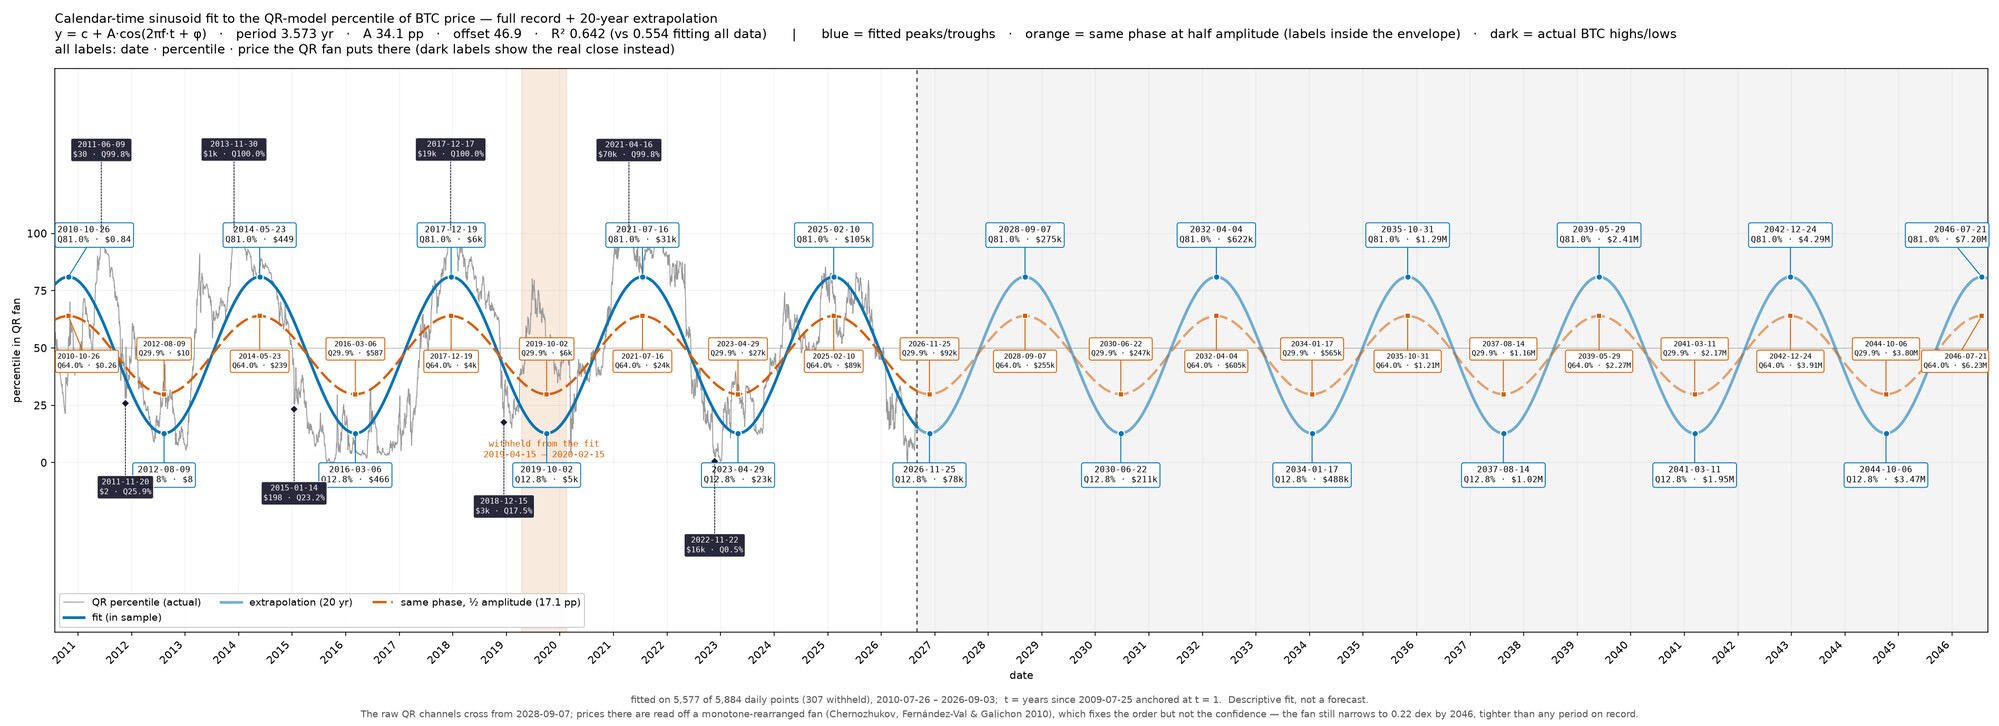
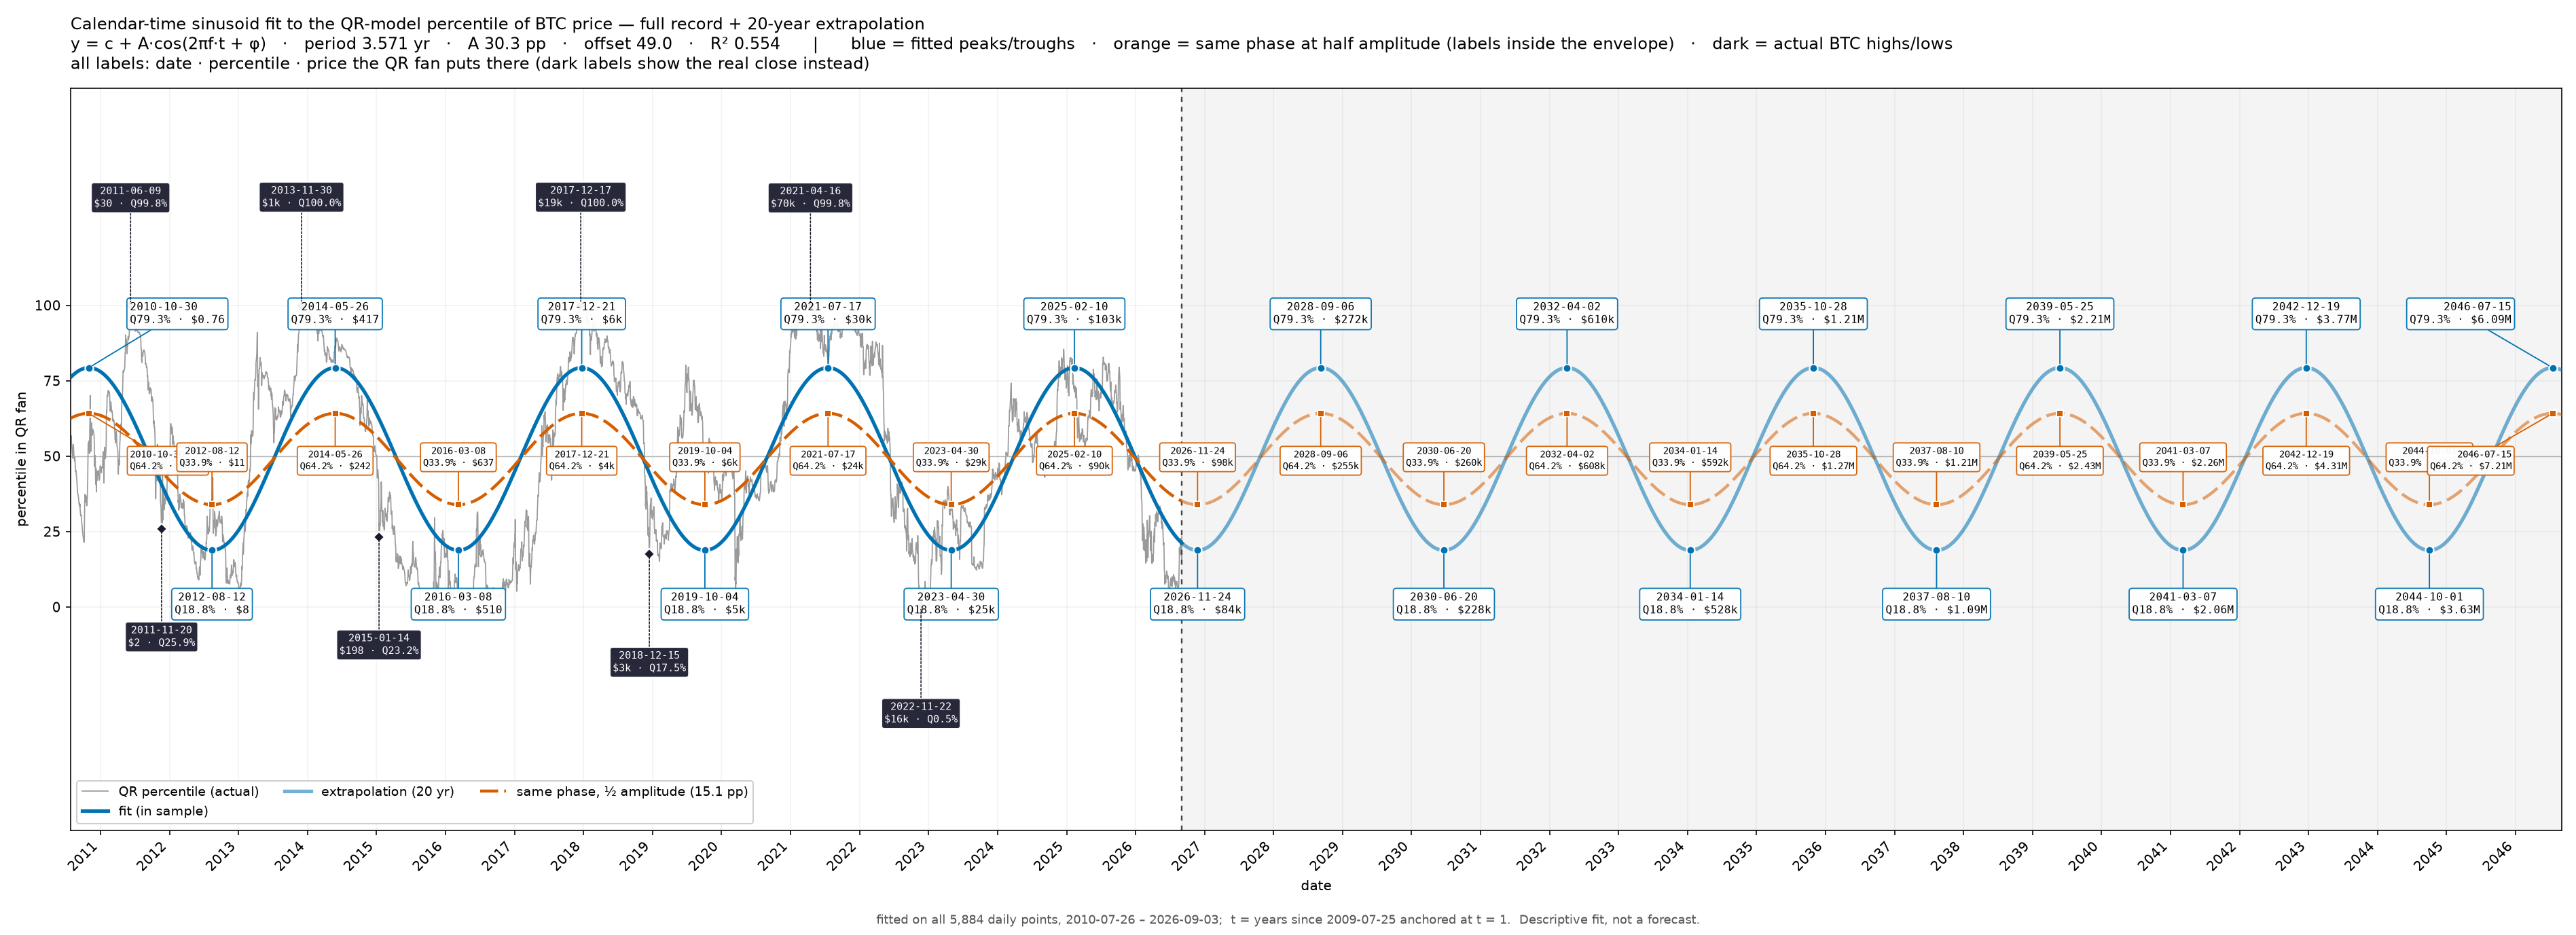
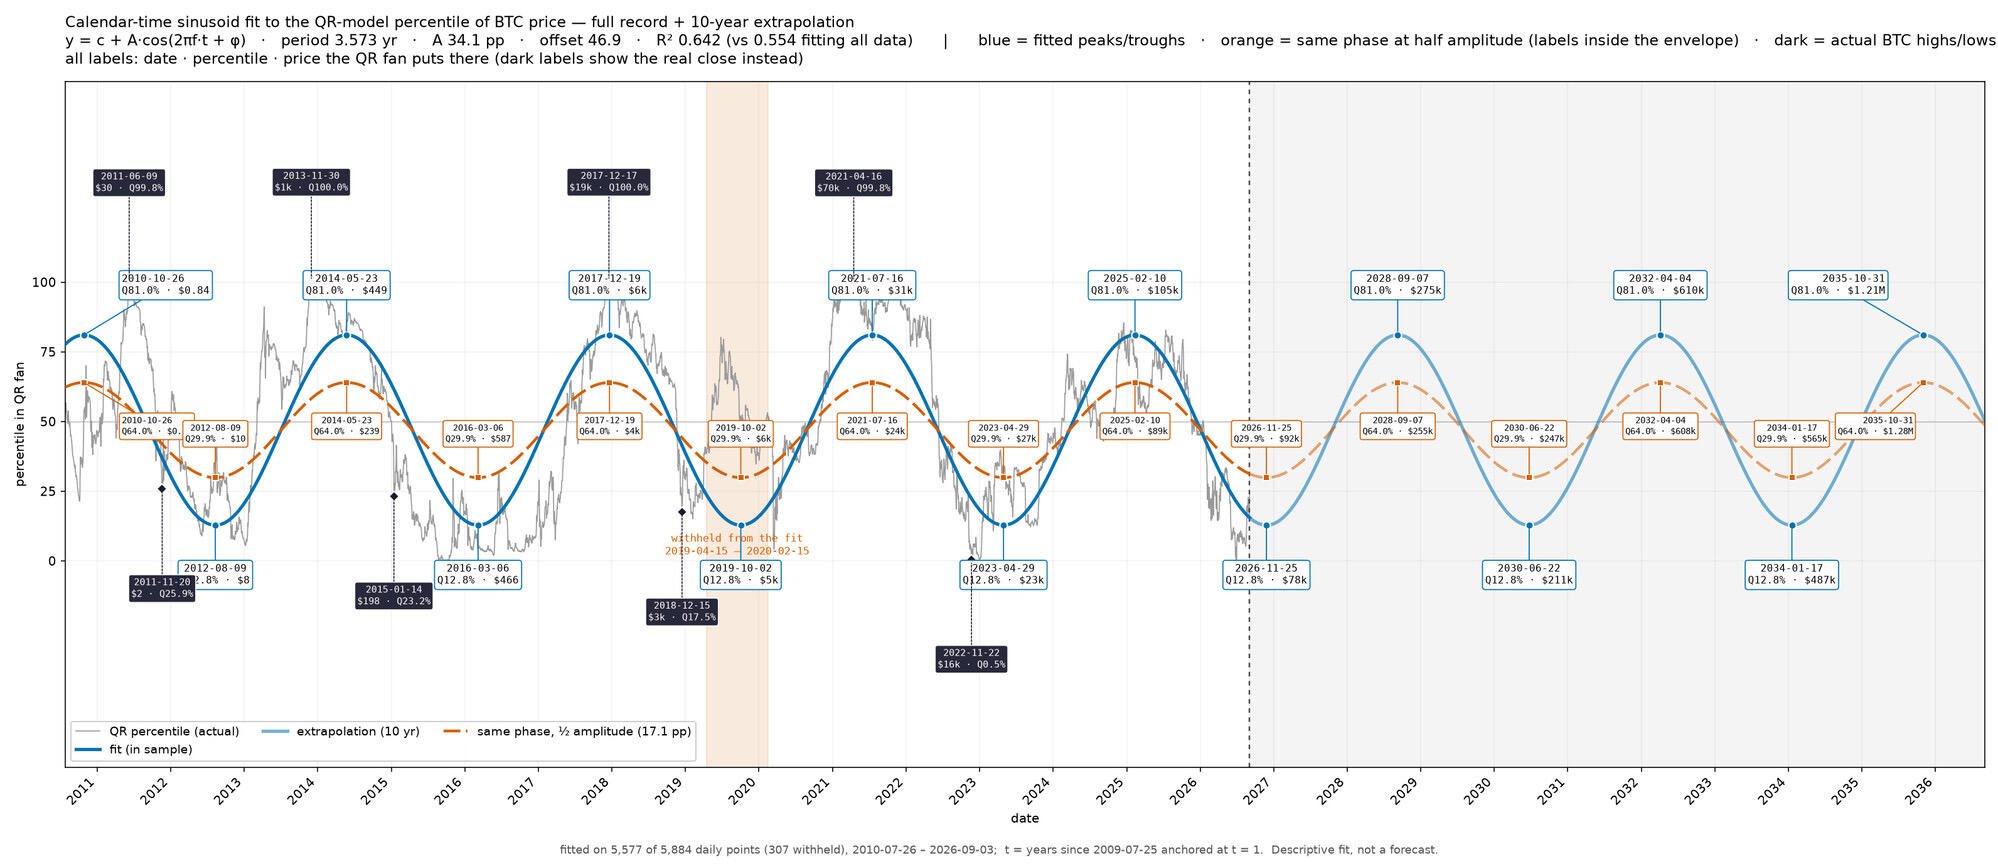
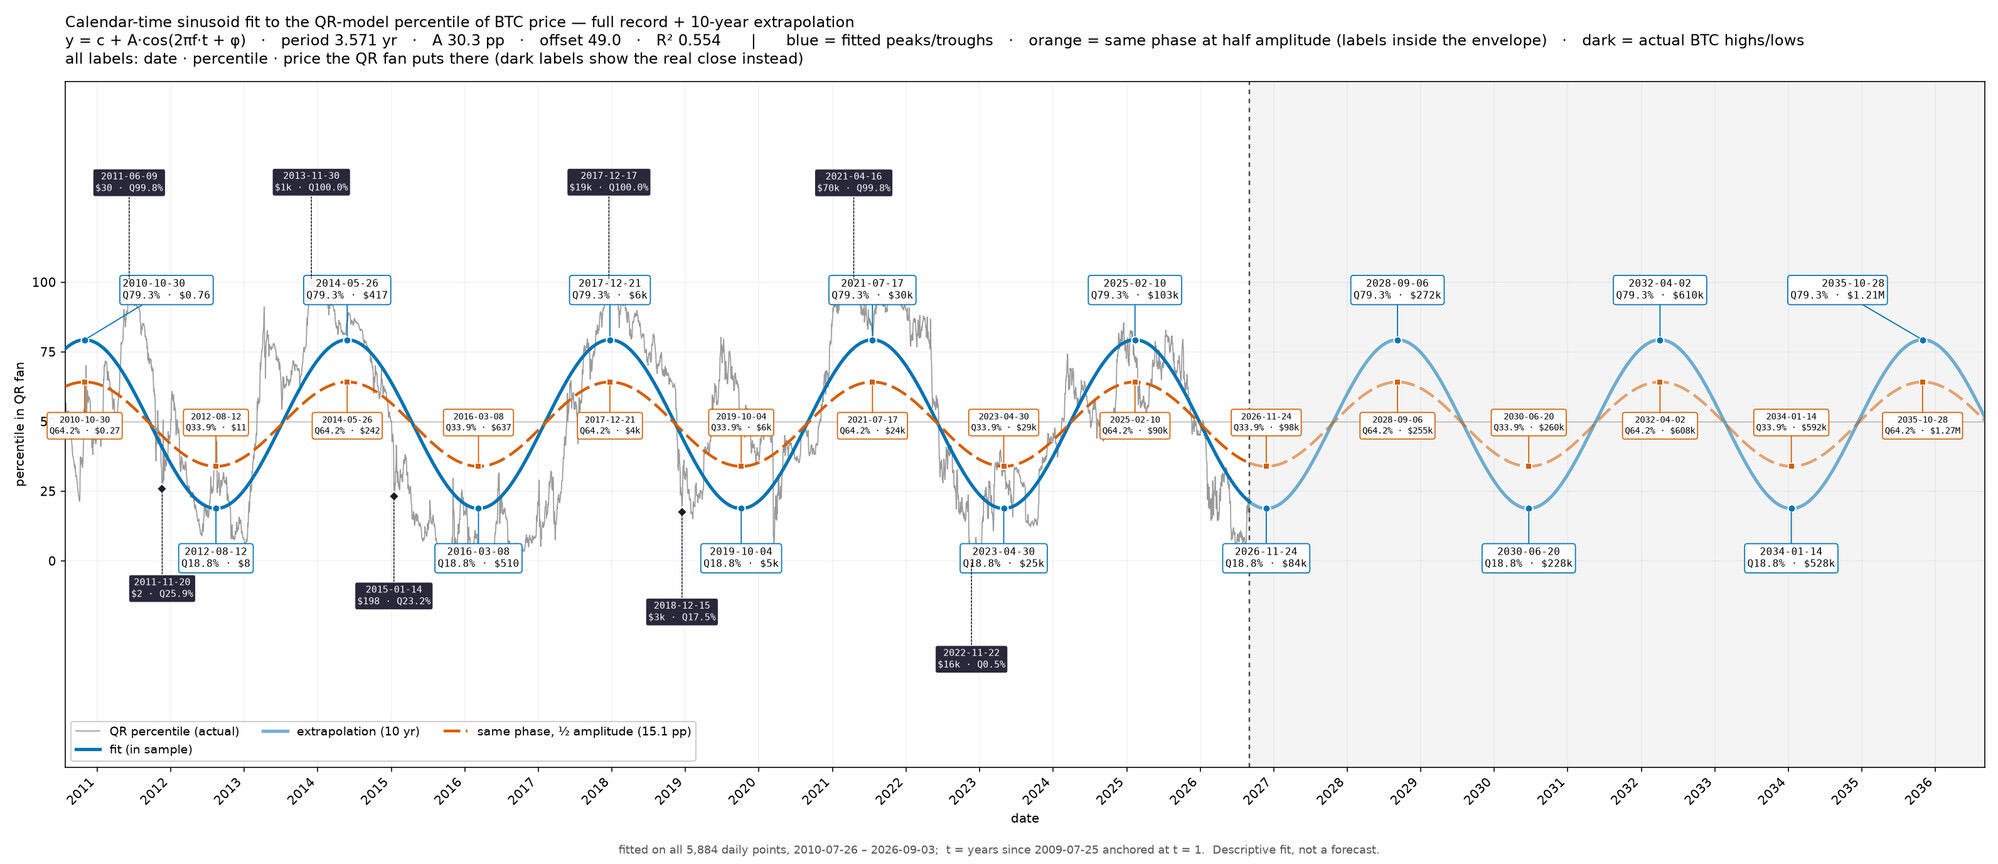
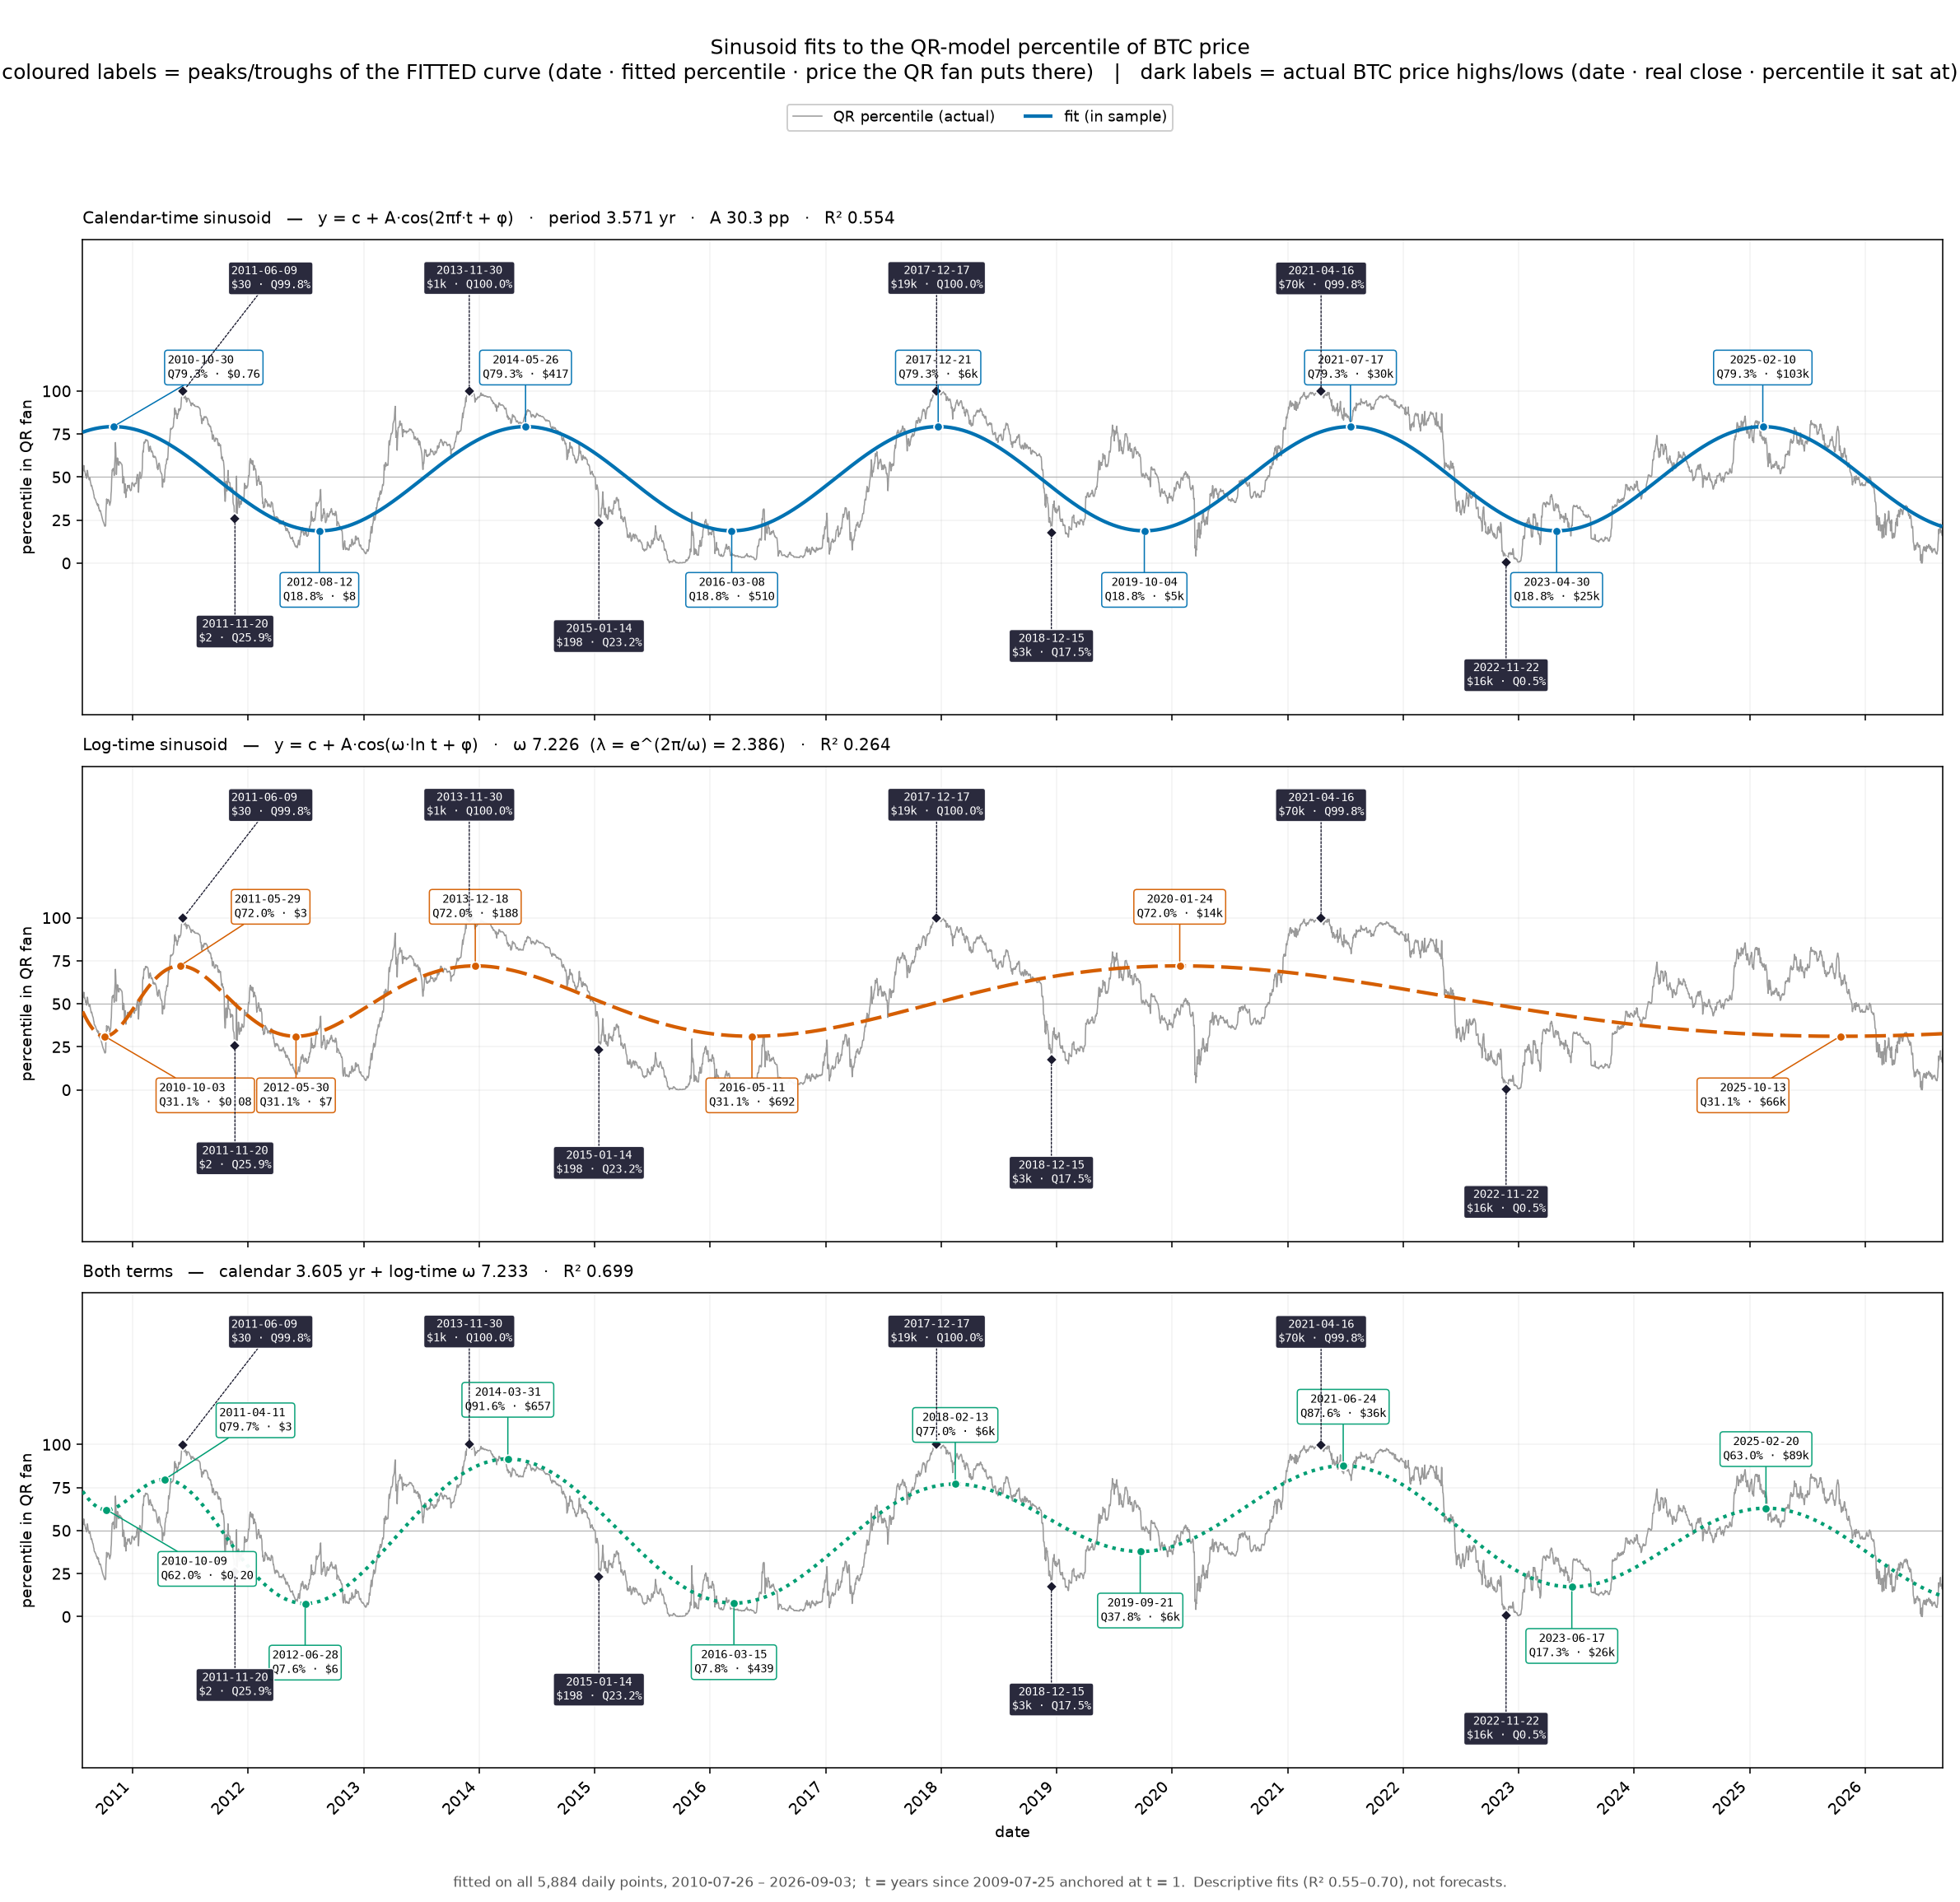
Anyhow, I had the idea to model the phase of the price along the repeating “4-year” price cycle rather than just the magnitude of the price. If you do a quantile regression on the power law model and plot the percentile over time, the result is reasonably well modeled by a sinusoid with 3.571 year period.
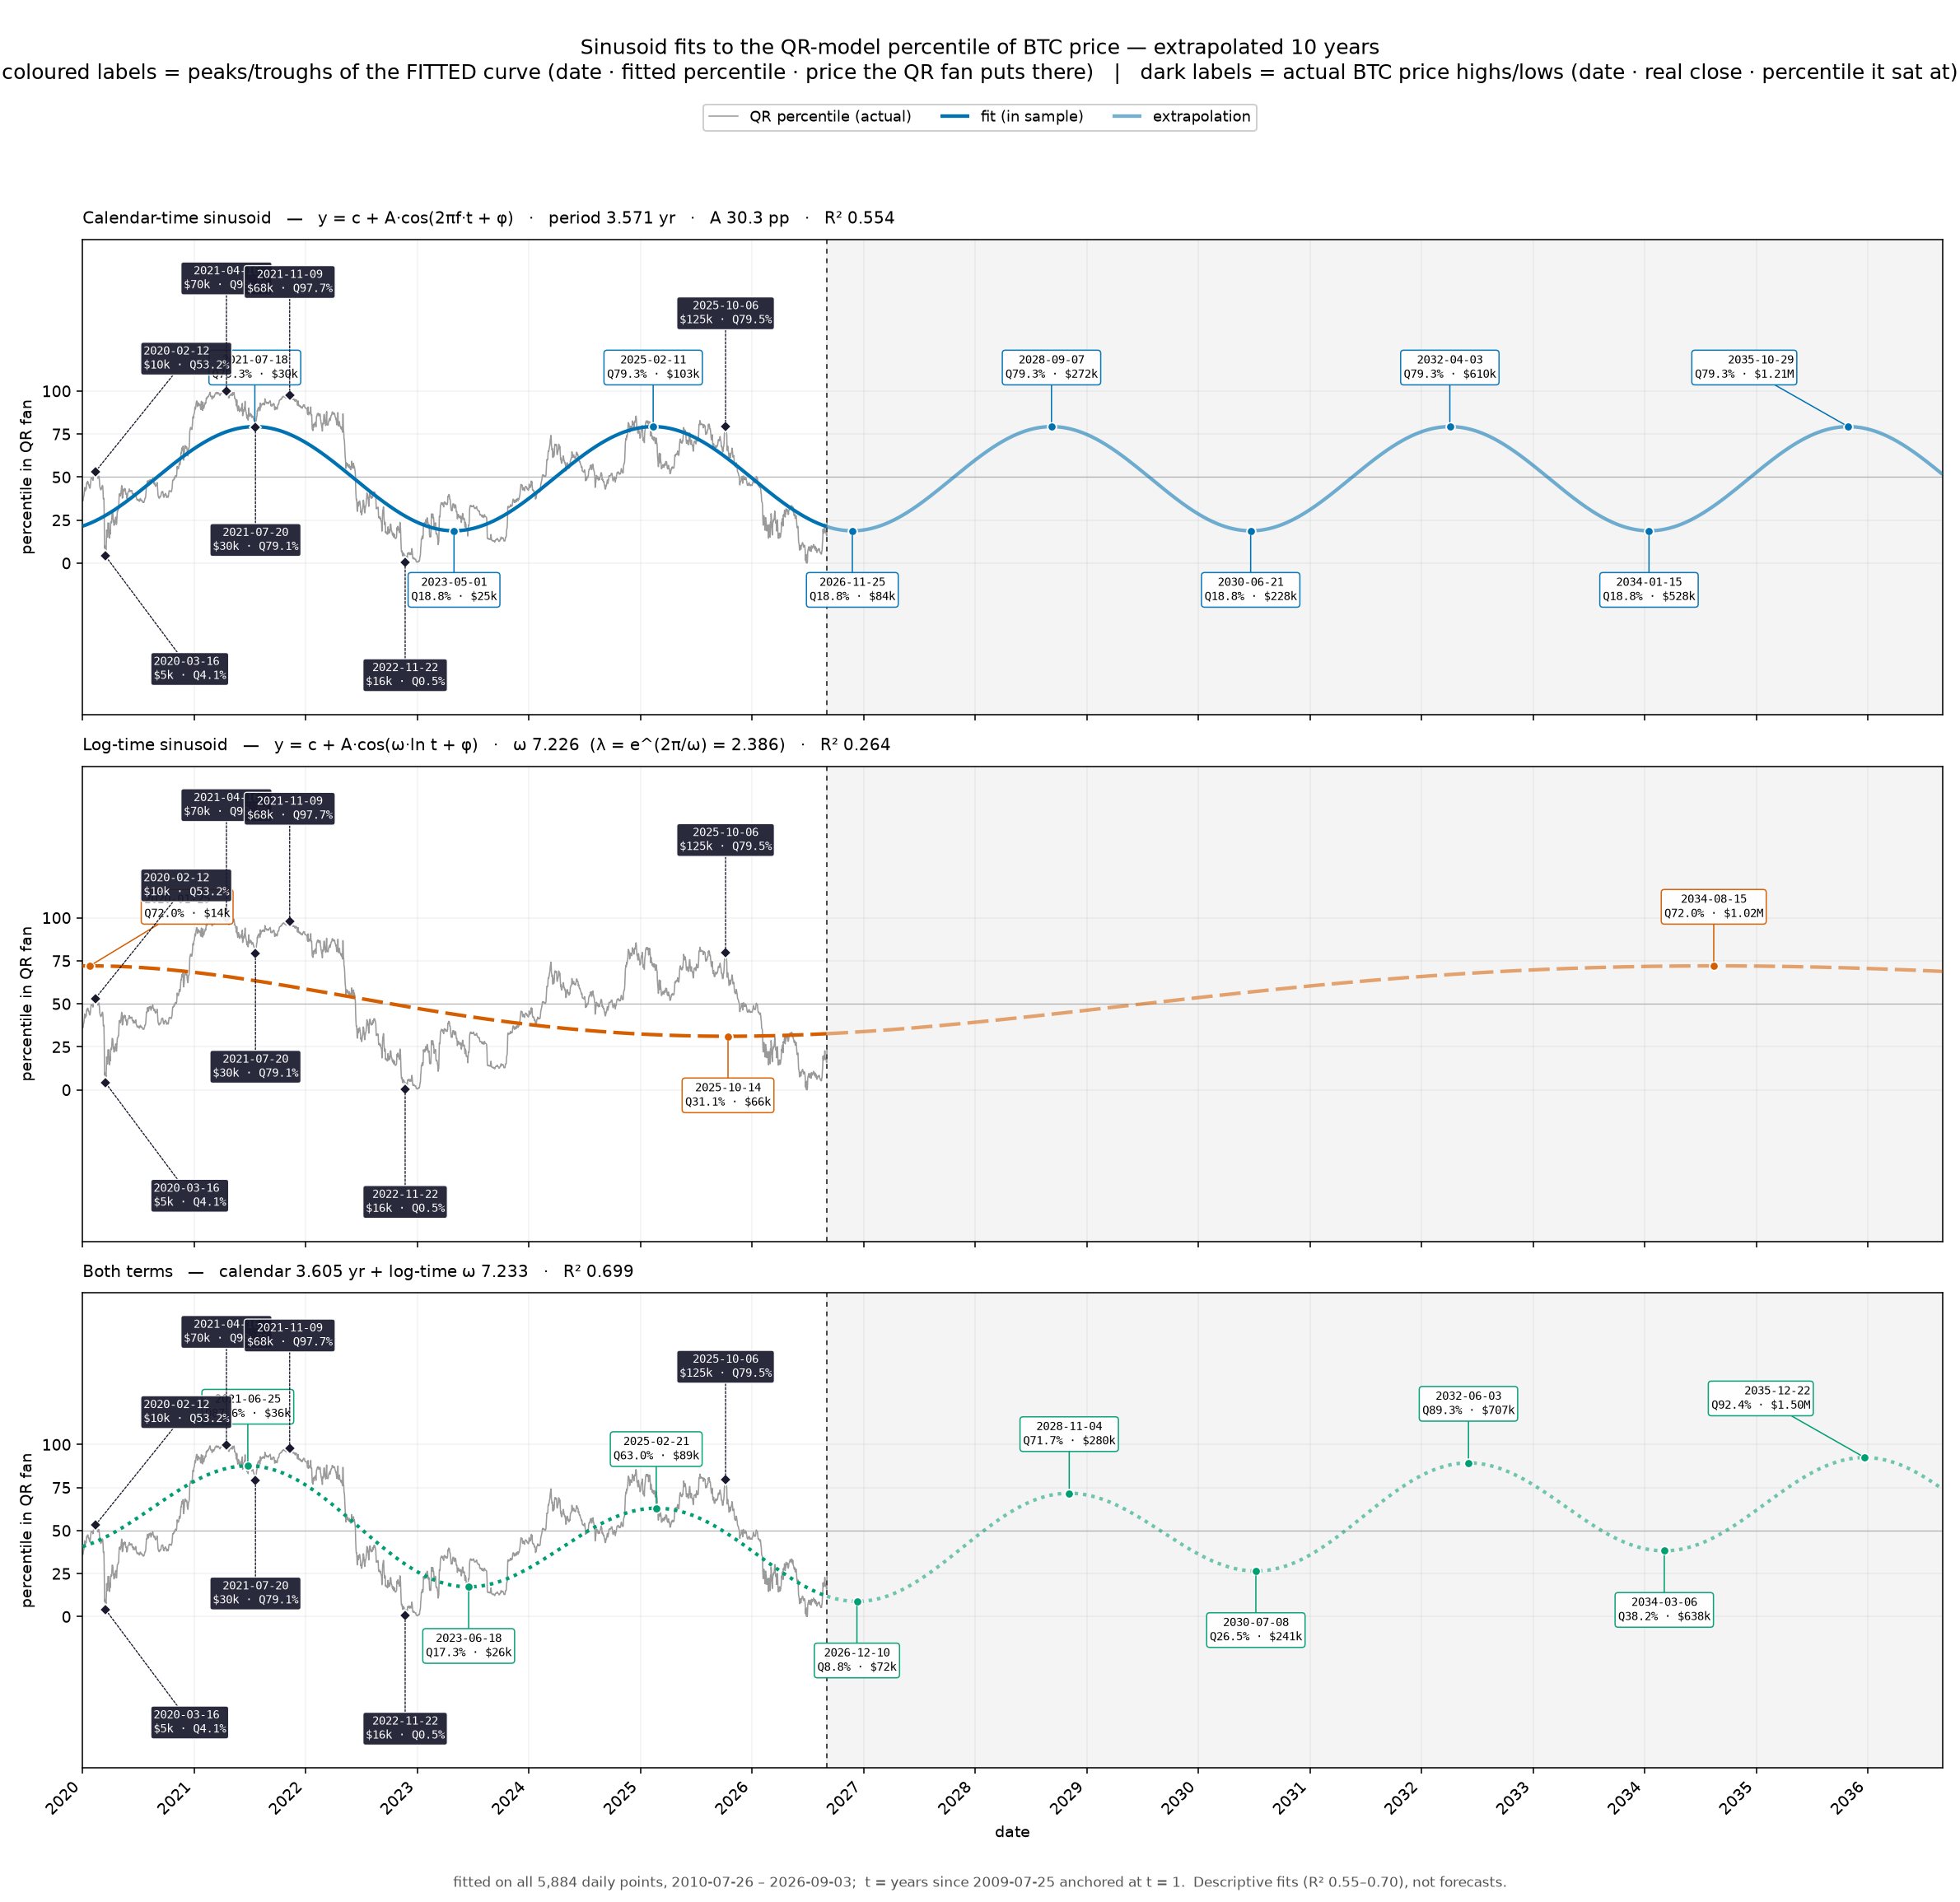
The whole log-periodic part visually doesn’t seem to add much. Mathematically it adds about half as much info as the calendar year sinusoid term.
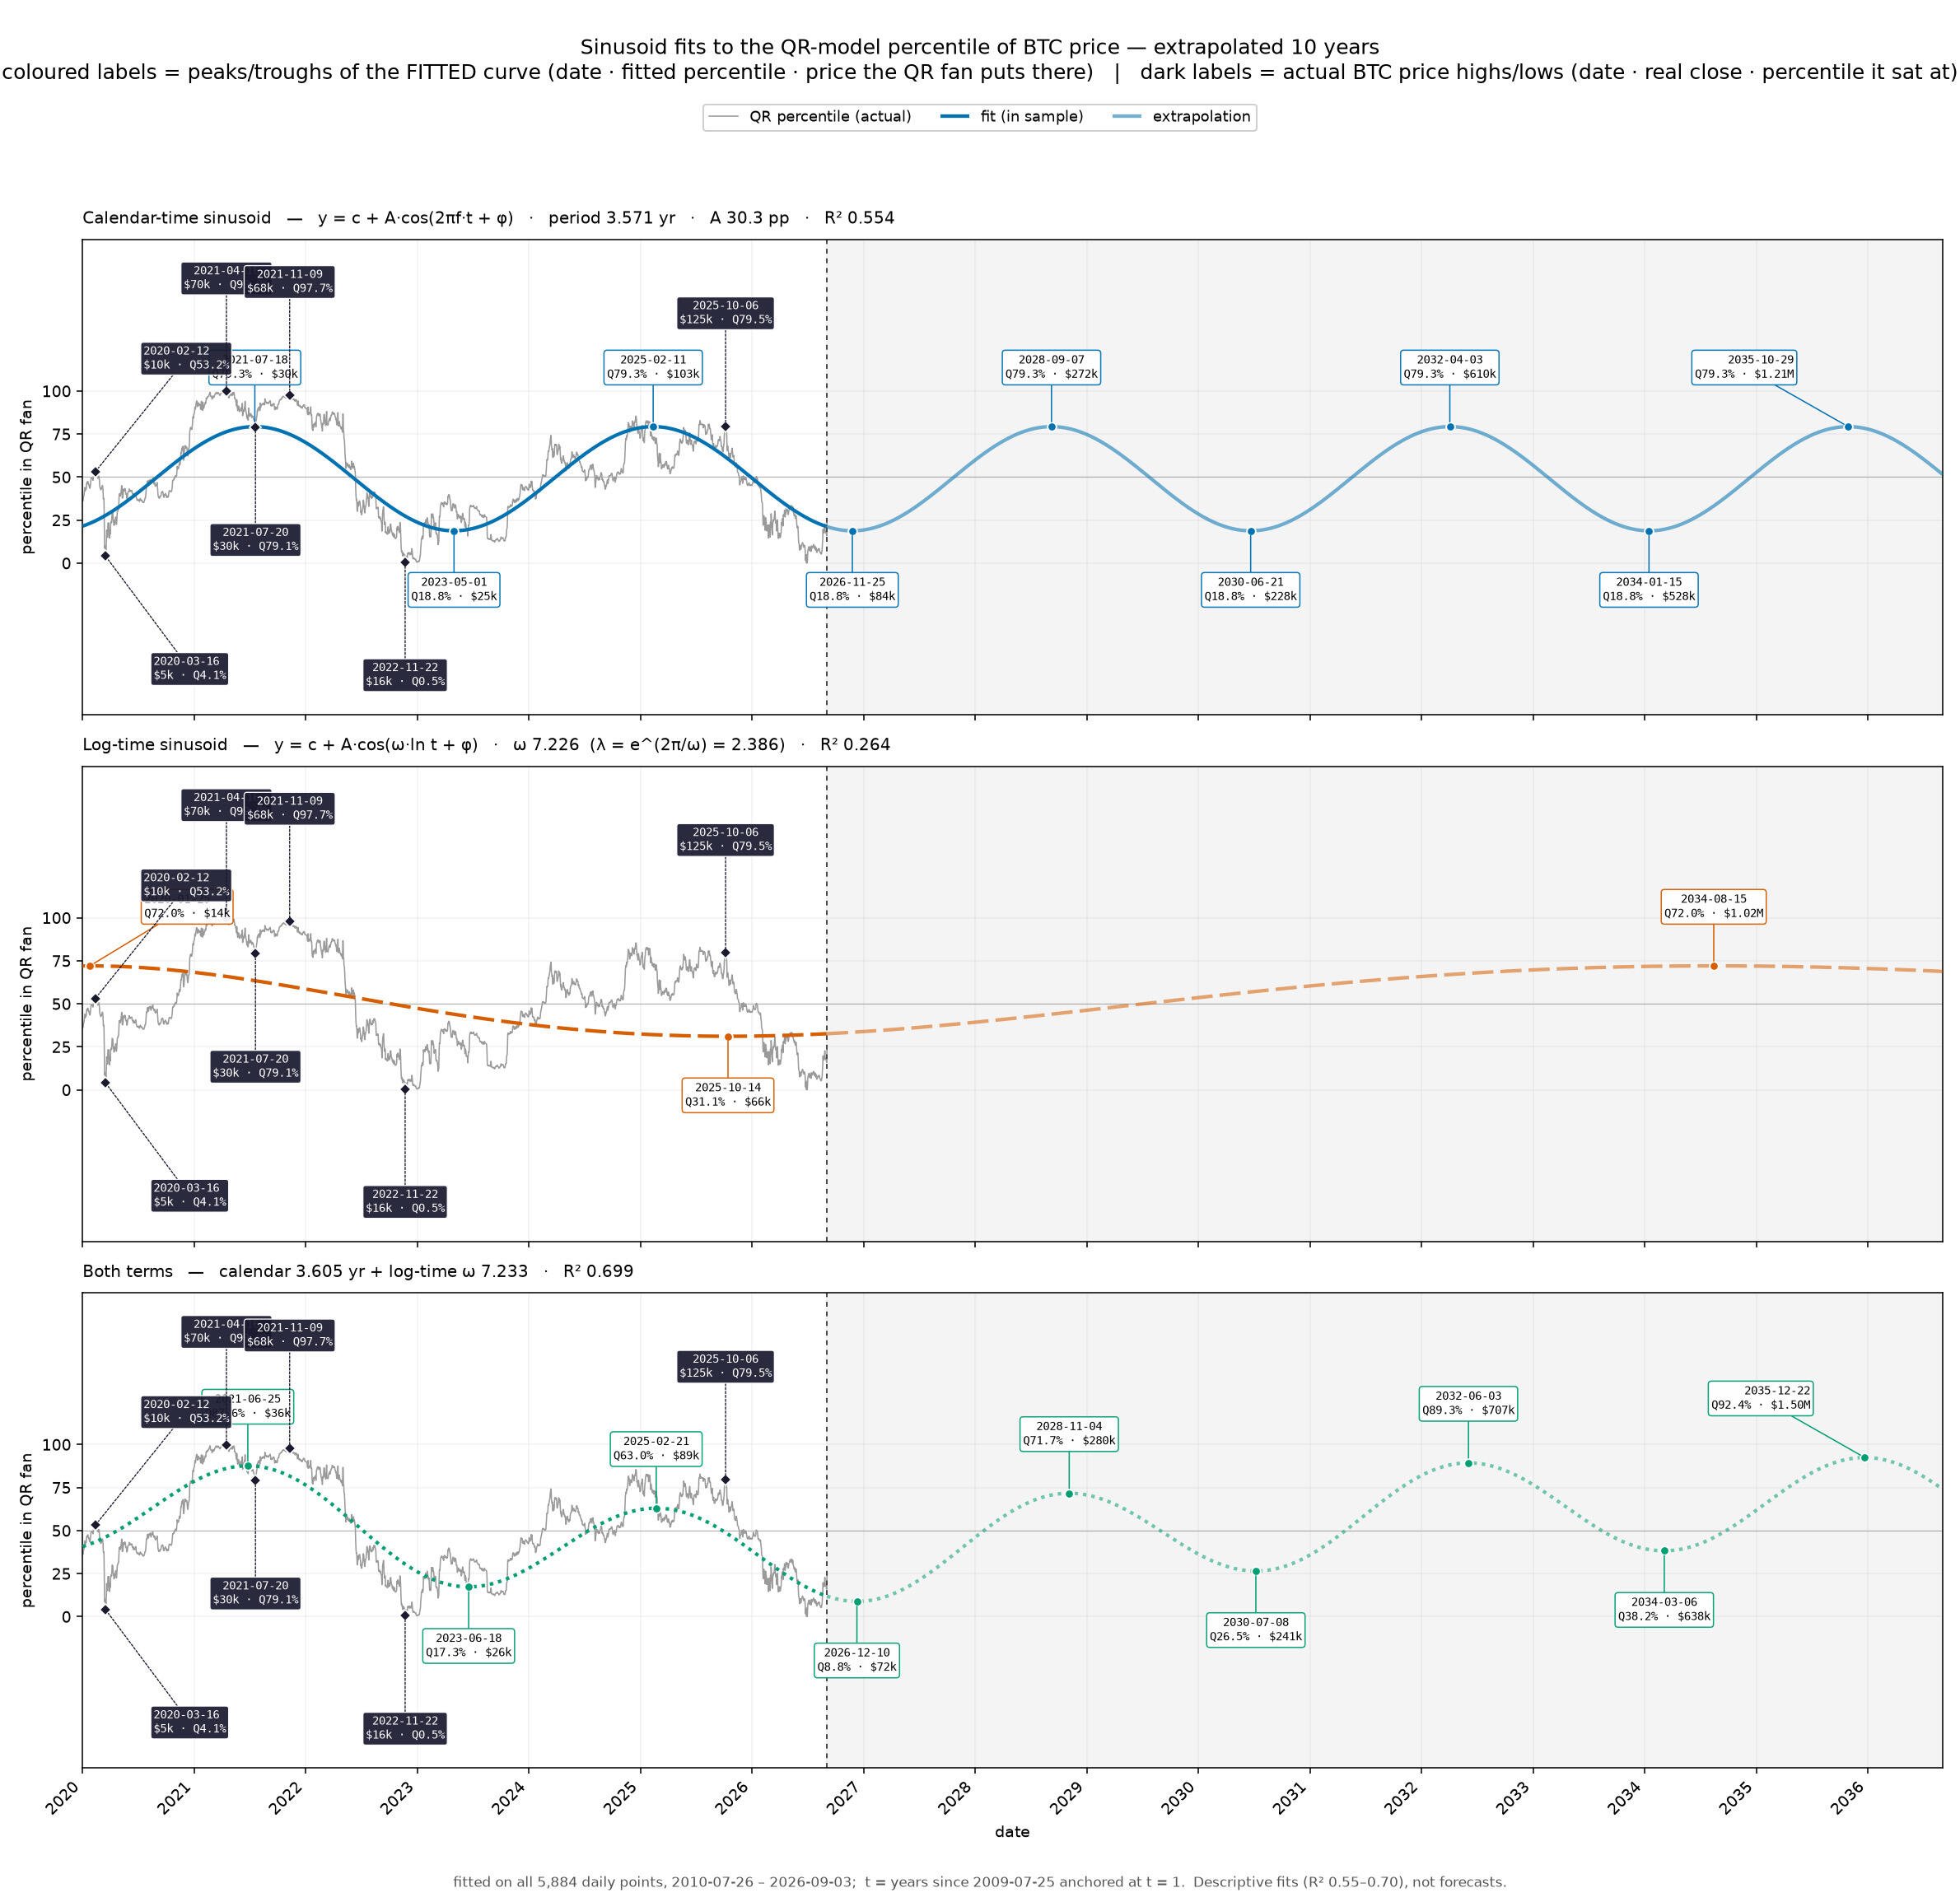
Anyhow, here are the calendar, log-time, and combined fits to all percentile data and a 10 year extrapolation. Note that instant with a t=1 time of July 2009 rather than January, but that’s long story.