
colin crypto
33zohShAgodfmNrXiMebtRTkqFtRkASGpV
npub1ume5...tl8y
GAIN CAPITAL
‘’All paper money eventually returns to its intrinsic value - ZERO" (Voltaire 1729) "Fiat is the scam that enables all other scams."
I DO NOT SELL COURSES 🗣️
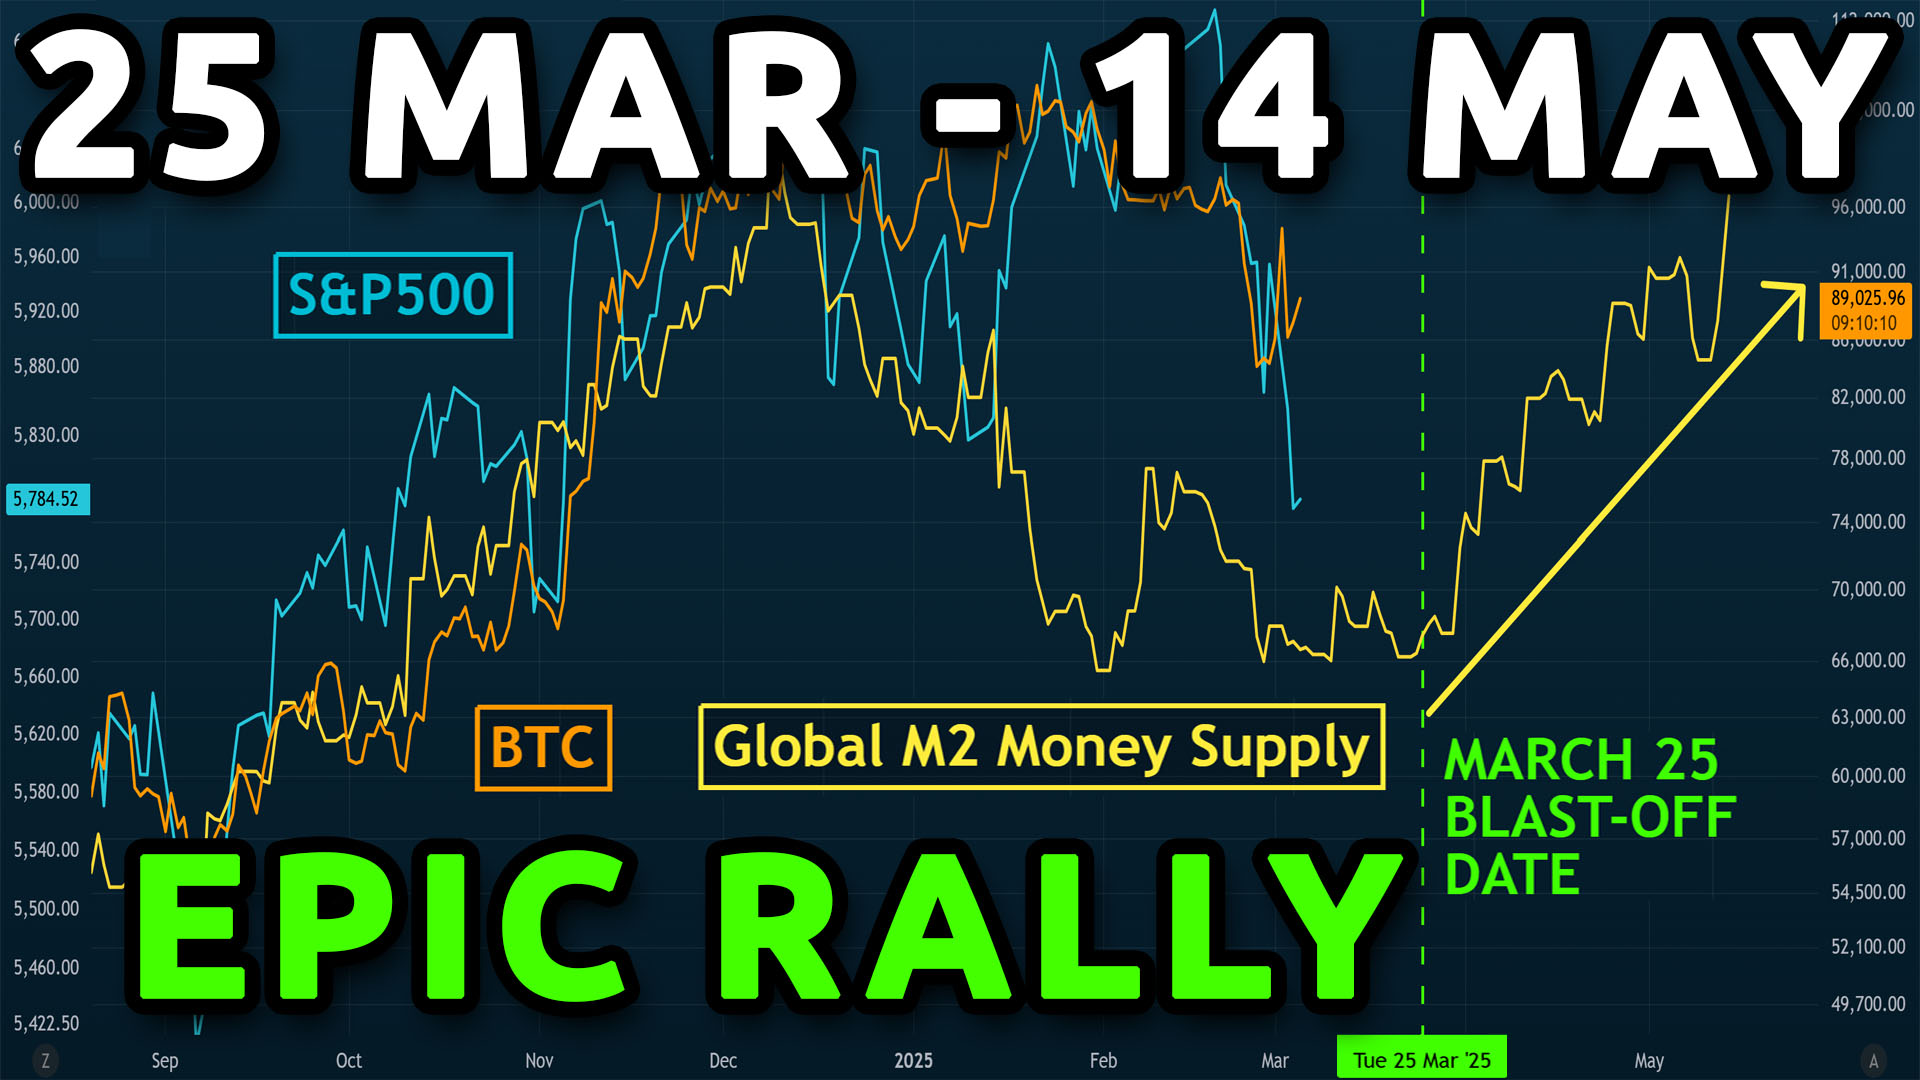
Global M2 Money Supply vs BTC
Predictive Correlation
- Two Scenarios -
Chart #1 (70 day offset)
🔸 Blast off Mar ~25.
Chart #2 (105 day offset)
🔹 Strongest mathematical correlation to BTC price movements (see this post: x.com/ColinTCrypto/s… )
🔹Says we have a mini rally around Mar 9-16, then a drop back to lows, with the real blast off occuring later.
🔹Blast off Apr ~30.
My job is not to dictate to you which scenario is right-- I'm just providing you with data. The big take-away is that a large global influx of liquidity is on the horizon.


Bitcoin today Bitcoin in 2045


Here’s something really cool.
@MarnyMarek compared 3 scenarios of Global M2 vs BTC
Chart #1 - 105 day shift
Chart #2 - 75 day shift
Chart #3 - 46 day shift
On each chart, the level of mathematical correlation is displayed on different time frames of the last 30 days, 60 days, 90 days, etc.
Based on this, the math says a 105 day shift is the most accurate of the three.
Implications: This 105-shift chart says the run up happens in the beginning of May.
I guess we’ll find out, based of if/when we see a big run up in BTC. Will it begin around Mar 25? Or early May?
I like sharing other peoples’ creations, as people create some really cool stuff.


Stocks & crypto crashing. Timeline in shambles. Fear left and right. And to top it off, the U.S. economy is legitimately overdue for a recession.
There’s a ton of indicators that point both directions (bearish and bullish). It can be kind of confusing what to make of it!
I am personally hinging my hopes on the Global M2 Money Supply for the next couple of months, as it shows a strong uptrend.
Furthermore, Global M2 just put in a new local high, continuing its uptrend further.
Will this be right in hindsight? I can’t tell you. Global M2 has about an 82% correlation to BTC’s moves (see chart #2). I guess I’m taking those odds. I’m not telling you to. It could fail. There’s no *guarantee* prices will head up. There’s always that 20% chance they don’t. Know this, going into it. ALL analysts and all traders get calls wrong. It’s part of the game.
Let’s hope this Global Money Supply is showing us what’s to come. We should know in a few weeks.
I’ll continue monitoring this closely and sharing its developments.


$71k - $73k is still the major support
Actually, I’d say it’s more like $67k - $73k. But nobody wants to hear that.
View quoted note →
$71k-$73k is the next major Bitcoin support level

The Bitcoin drop we have seen from $109k to $78k is a 29% drop.
A 35% drop would take BTC down to $71k. That is not unheard of for a bitcoin correction during a bull run.
That would also coincide with the top of major support.

You can ignore #Bitcoin, but you cannot ignore the consequences of ignoring Bitcoin.

This is the part where you do nothing and are greatly rewarded later.
It’s one of the most difficult skills: do nothing.
The more negative replies to this, the more likely it is true. Sentiment.
Sell the CAVE CHEESE 🧀🕳️ and buy Bitcoin!!! 😂
(point #5)

The Global M2 Money Supply chart reveals a striking trend:
The sheer scale and persistence of the M2 increase are impossible to overlook—and they seem to grow more significant every day.
With an 82% correlation to Bitcoin (BTC), even if M2 doesn’t perfectly predict BTC’s rise, the magnitude of this surge is so substantial that risk assets, including BTC, will inevitably be propelled upward by at least a portion of this momentum—if not all of it.
Put another way: the M2 climb is too massive and sustained to dismiss. It’s not just a minor blip on the chart—it’s a towering ascent. Risk assets have no choice but to ride this wave, whether partially or fully.
Buckle up.

This chart shows why the Global M2 Money Supply is so effective in predicting BTC’s future price direction
View quoted note →
Here’s what the US government supposedly holds.
(Note: no $SOL, $XRP or $ADA, as Trump promised)
Source—


Intel Platform | Arkham
Intel Platform | Arkham
Arkham Intel is a blockchain analytics platform that deanonymizes the people and companies behind blockchain wallets & transactions
Directional Alignment with Global Liquidity
“Bitcoin moves in the direction of global liquidity 83% of the time in any given 12-month period, which is higher than any other major asset class, making it a strong barometer of liquidity conditions" @LynAldenContact (source of chart & quote)

Poor guy.
Exhaustion before the pump.

Everyone is talking about the Global M2 Money Supply predictive correlation to the Bitcoin price!
Here's a clip from @TheCryptoZombie
Thanks for the share!
If you want to watch my full video on this fascinating correlation of M2 vs BTC, see it below
Coingraph posted my chart without crediting me😒😒oh well🔥

👀
So, basically Trump’s WLFI currently holds 96% ETH or Ethereum-based assets.
Got it 👍
