colin crypto's avatar
colin crypto
33zohShAgodfmNrXiMebtRTkqFtRkASGpV
npub1ume5...tl8y
GAIN CAPITAL β€˜β€™All paper money eventually returns to its intrinsic value - ZERO" (Voltaire 1729) "Fiat is the scam that enables all other scams." I DO NOT SELL COURSES πŸ—£οΈ
colin crypto's avatar
Colin 9 months ago
Bitcoin price has formed what I would consider a possible short term local topping pattern: three daily candles with tall upper wicks. (see white circle in 1st chart) This doesn't mean BTC needs to correct for long. It could just be a matter of days. Or could be a bit longer. 
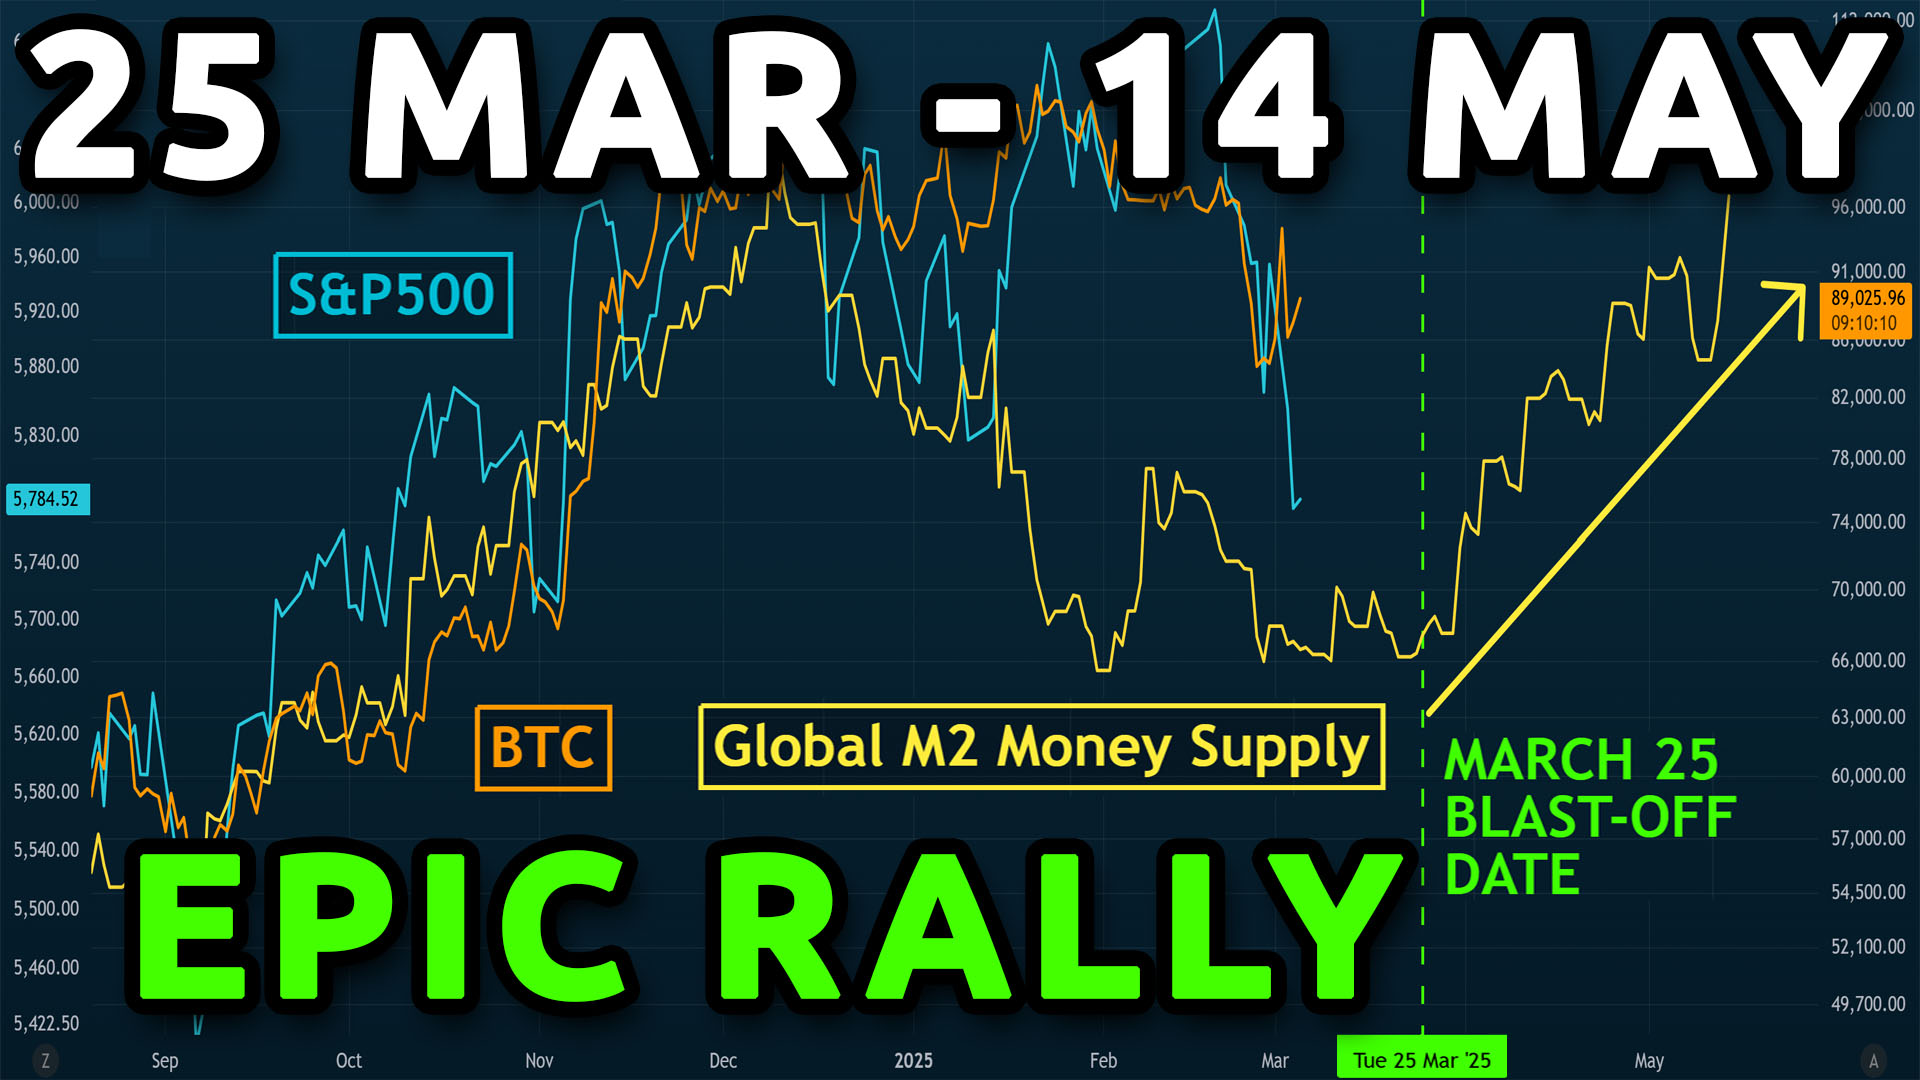
Combine this with the pattern fitting of the Global M2 vs BTC chart, and we see a similar forecast. The "MINI RALLY THAT FAILS?" (see circled area in 2nd chart) is still playing out and hasn't been violated. This further backs up the idea of a short term correction. Lastly, the simple fact that BTC has recently climbed into the resistance zone $89k-$92k (see white dotted line in 1st image), is another reason why BTC could cool off for a little bit before breaking through. My general, long-term outlooks is still bullish (in the months to come), especially with that massive injection of M2 liquidity coming (yellow line on right side of the 2nd image). So, we have, in my estimation: a short-term correction (days or several weeks at most), and then a couple months of blast-off after that. Lastly, maybe I will be wrong and we just go up from here. That would validate the 70-day offset version of the M2 chart. We'd all welcome it.
colin crypto's avatar
Colin 9 months ago
It will be interesting to see what BTC does next. πŸ”Ή Chart 1: BTC is approaching major overhead resistance. Price tends to reject from resistance. πŸ”Ή Chart 2: The M2 line (with 107 day offset) heads down for a little while in the "rally that fails". Both of these charts match in most probable outcome if BTC rejects from the resistance. I think that BTC will eventually break upward, but it may not be immediately. That being said, we all hope both of these charts are violated and BTC just soars, blasting through all resistance, but I wouldn't make a confident bet on that. Not impossible, though.
colin crypto's avatar
Colin 9 months ago
Step 1: IMF demands countries, like El Salvador, must NOT hold any Bitcoin. Step 2 (a mere 18 days later): IMF legitimizes Bitcoin. Sounds like the same tactic that JP Morgan used in the U.S.: first they talked bitcoin down, lying about their intentions in order to get lower BTC prices, and then announced they are cool with it once they’ve accumulated.
colin crypto's avatar
Colin 9 months ago
Global M2 Money Supply vs BTC It will be interesting to see what happens from here. 1. Will BTC continue to follow the "mini rally that fails" (as pictured) and then blast off later? This would validate the 107 day offset. 2. Or will BTC blast off immediately? That would validate the ~70 day offset. My bet is still on the pictured 107 day offset chart, but anything is game, and remember, regardless which offset is right, the BIG PICTURE is: A massive, 2-month-long M2 liquidity injection is coming our way, and it could go for longer if M2 keeps going up. That's mega bullish and keeps me inspired for what's to come this cycle. image
colin crypto's avatar
Colin 9 months ago
The creator of the Bitcoin Power Law (@Giovann35084111) has just validated the "incredibly high" relationship between Global M2 and the Bitcoin price. The power law chart applies a logarithmic view of both the x and y axes. If you've been following me, you know that the M2 vs BTC correlation was fairly tight from our own calculations. It's now even further validated, seeing that this relationship also holds true with the "Power Law". Quite a compelling chart. Stepping back, it does make sense that price moves of risk assets are a byproduct of liquidity. If a lot of money is introduced, then risk assets head up as money finds their way into them. Conversely, if there's no excess money sloshing around, how can they pump? Thank you, Giovanni. image
colin crypto's avatar
Colin 9 months ago
Global M2 vs BTC update I still think this is the most likely scenario. Note that doesn't mean it's the only scenario. πŸ”Ή Blast-off date around APRIL 30, using a 107-day offset for Global M2. (has a high mathematical correlation) πŸ”Ή Rally could last for 2 MONTHS, based on how long the M2 line goes vertical (rally could extend longer if M2 continues going up) πŸ”Ή Regardless of the accuracy of the "blast off date", the massive influx of global M2 capital is coming. Don't get caught up in the weeds regarding the exact day. Look at the big picture. If this subject is new to you, learn more about this apparent, predictive correlation of Global M2 to Bitcoin price movement in the video, in the reply below. image
colin crypto's avatar
Colin 9 months ago
Global M2 Money Supply vs Bitcoin Pictured: 70 day offset (blast-off begins March ~24) 107 day offset (blast-off begins April ~30) Depending which scenario plays out, determines when the influx of global liquidity may find its way into BTC. We are all hoping for the earlier scenario (the 70 day offset), but note the mathematical correlation is significantly higher on the 107 day offset. In the end, the result should be the same. The massive run-up in global liquidity is finding its way through the system and coming to (hopefully) pump our risk assets (stocks, bitcoin, crypto, $MSTR, etc). Maybe the right path for M2 is a 70 day offset. Maybe it's 107. Regardless, the BIG MOVE is on the right of the charts. Relax and enjoy the show. We'll find out soon enough. image
colin crypto's avatar
Colin 9 months ago
For all the people talking about China's vertical spike in the money supply, this is a nothing burger (as @intocryptoverse has correctly pointed out). The spike in the China *M1* chart was due to change in how the chart is calculated rather than an actual increase of money. The Global *M2* Money Supply chart is unaffected by China's change, since this change of calculation affected the China *M1* and not China *M2*. Here's what changed: "Effective January 2025, China's People's Bank of China (PBOC) revised the definition of M1, expanding it to include personal demand deposits and customer reserve funds held by non-bank payment institutions, in line with practices of other major economies." See below.
colin crypto's avatar
Colin 9 months ago
Global M2 Money Supply predictive correlation to $MSTR @MicroStrategy forecasts an APRIL 23 blast-off date. This was a popular request, so here it is. It is compelling, but interestingly on a different time frame than BTC. πŸ”Ή The best mathematical fit of Global M2 vs $MSTR is a ~69 day offset. πŸ”Έ The best mathematical fit of Global M2 vs $BTC is a ~107 day offset. This means it looks like MSTR could pump about 38 days before BTC does. Maybe that's because it's a stock and capital finds its ways to stocks more quickly. Yes, there are Bitcoin ETFs, but they are rather new. To answer some questions before you ask: I only provided the 46 day, 69 day and 70 day because they were the strongest correlation of any I checked. There were no other offsets worth sharing because they were weaker. I checked many M2 offsets, from 30-100. If you want to understand how the M2 could possibly predict price movements in advance (I know, it seems crazy), watch the video below. It will catch you up to date on how this works. Remember: nothing shown here is a guarantee. It's all odds, and nothing is 100%. image
colin crypto's avatar
Colin 9 months ago
Global M2 Money Supply predictive correlation to Bitcoin price movements In an effort to have maximum accuracy with the correlation, I have calculated all the most-suggested scenarios of various M2 offsets, and here are the mathematical results. It is irrefutable.
colin crypto's avatar
Colin 9 months ago
Clients on signal going crazy πŸ”₯πŸ”₯πŸ‘congratulations to everyone involved πŸ“ˆβœ…
colin crypto's avatar
Colin 9 months ago
After years of stagnation of my YouTube channel, and sometimes losing subscribers when I released a video (LOL), it was really nice to see this for a change. It may not be a lot compared to some other big channels out there, but it's a lot to me. Thank you, everyone. 🩡 image
colin crypto's avatar
Colin 9 months ago
One of the most common comments I’ve seen is β€œwhen will altcoins pump?” Once ETH takes off, then altcoins will surge. That will prob happen in 1-2 months. It may time with QT ending and QE beginning, as Benjamin Cowen suggests. I think there is merit to this idea. Polymarket is giving a 100% chance of QT ending before May. (See image) Also, M2 takes off at the end of April/beginning of May. That may also time with this transition to looser monetary policy. Stars are aligning for a long overdue altseason to begin in 1-2 months, at a rough estimate. image
colin crypto's avatar
Colin 9 months ago
Global M2 Money Supply vs Bitcoin BTC continues to track the "mini rally". Not much change daily, but some people want to keep their eye on it, so here is today's chart! Learn more by watching the video below if this is a new subject for you. It will catch you up to speed. image
colin crypto's avatar
Colin 9 months ago
It looks to me like BTC has at least 3 more days until the top of that mini rally (see yellow box in middle). Enjoy it. Some much needed relief! (M2 Global supply with a 107-day offset seems to fit best currently. Blast off date estimated around April 30) image
colin crypto's avatar
Colin 9 months ago
Global M2 Money Supply predicts Bitcoin's next move. We find which offset is best! Get the M2 script for TradingView here:
↑