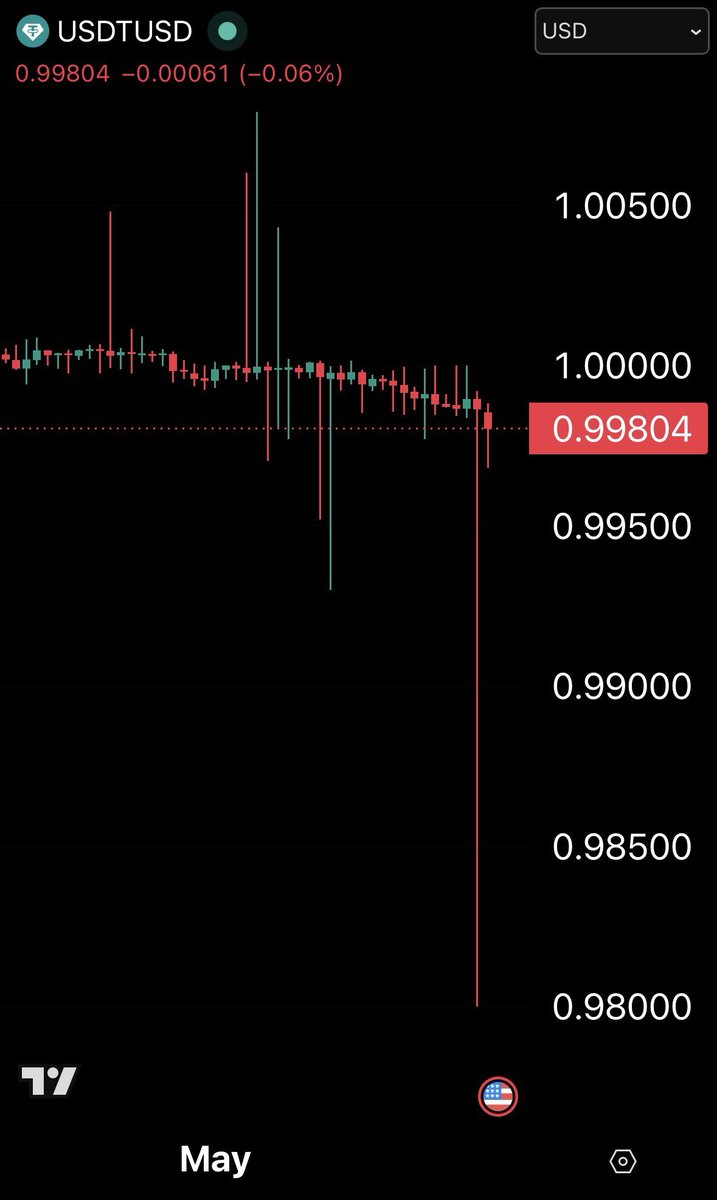
Bitcoin fell under $67,000 at noon. Down five thousand in two days. One billion in liquidations across crypto. BlackRock's spot Bitcoin ETF sold four hundred forty million in a single session.
The tape is loud and bearish.
Here is what does not show up on that tape.
84.7% of the transactions on our exchange today are buys.
76% of transactions this week are buys.
The price chart is the redemption flow at BlackRock. The price chart is the Strategy filing. The price chart is the leveraged liquidation cascade.
The story the price chart misses is the saver who looked at the move this morning and bought another stack. The saver who bought yesterday. The saver who has been stacking every day this week on the exchange that lets them withdraw to their own keys.
A retail Bitcoin holder watching the price drop is not selling. A retail Bitcoin holder watching the price drop is filling the order they have been praying would hit.
The price chart shows volatility.
The buy tape shows conviction.