Peter du Toit's avatar
Peter du Toit
peterdutoit@peterdutoit.com
npub144ed...urkq
I speak about climate futures, mitigation and adaptation in the face of the climate crisis. 🇿🇦
What you are looking at here is the 2m temperature anomaly projected for parts of China tomorrow March 9th. Of course this has alarm bells ringing as a result of the record breaking 74-day heatwave experienced in China in August of last year. China is the world second largest economy and the events of last summer was a warning shot across the bow. (You can read more about this here. 
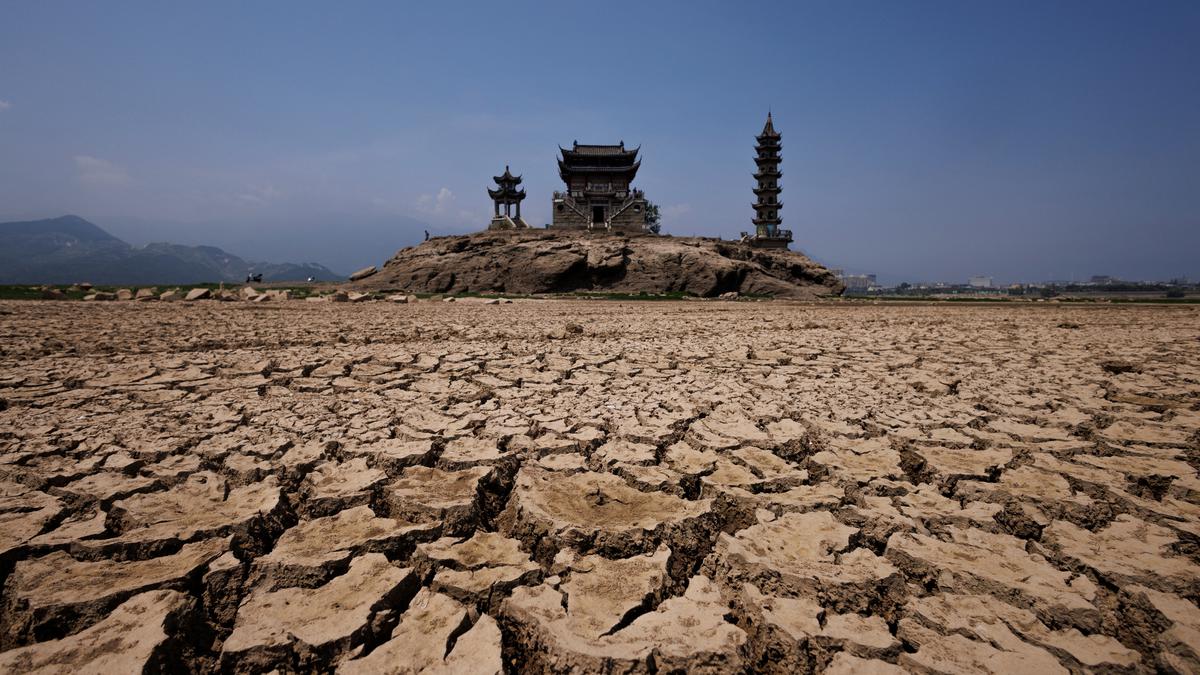
Supply chain disruption is going to be one of the issues we have to contend with as we continue to heat. image
Satellites now play a crucial role in our understanding of what is causing CO2 & CH4 to rise. Analysing satellite data for last year the team at Kayrros (https://www.kayrros.com) identified 1,005 CH4 super-emitter events in 2022, of which 559 were from oil and gas fields, 105 from coalmines, and 340 from waste sites, such as landfills. These are pictured here: image #ClimateLiteracy #Methane
You are looking at the storm that now holds the new record for being the longest lasting tropical cyclone since records began. Current duration 33 days. (Previous record Typhoon John which lasted 31 days) #CycloneFreddy is projected to reach Mozambique for a second time on day 37. (March 12th) image
Wow check this out. Tropical #CycloneFreddy slammed into the east coast of Madagascar on Feb 21st then passed over land into the Mozambique Channel where it gathered some strength and then made landfall in Mozambique a week later on Friday Feb 24. But it’s now back in the Mozambique Channel heading back towards Madagascar to make landfall on Sunday March 5th — but this time on the west coast! image
We are going to have to figure out how to adapt faster than the impacts arriving at pace as a result of the heating planet. One major project that is underway is a global early warning system to warn of impending impacts and hopefully give people time to prepare. (You can read out this here https://public.wmo.int/en/earlywarningsforall) The current risk assessments estimate approximately 3.3-3.6 billion people live in hotspots of high vulnerability to climate change. Near term (2023-2040) the people at heightened risk are: 🌡️ People living in places that are already close to their thermal limits 🏝️People living along coastlines 🧊People living near seasonal rivers and ice. One place that has parts close to their thermal limits is India. They are not new to heatwaves and on avg have about 5-6 of these events a year. In 2022 the intensity was ramped up a couple of notches and they just experienced an extremely hot February. From the IMD press briefing yesterday: image And projection for March-May image #Adaptation #ClimateLiteracy
So the European Space Agency and European Commission Copernicus Sentinel-1 satellite provides weekly monitoring around the whole coastline of Antarctica. Using 10,000 satellite images generated between 2014 and 2021 researchers have found that the Antarctic glaciers are travelling into the ocean much faster than the 1km/year originally thought. This of course has some serious implications for northern hemisphere coastlines over time. Here is the study released today: https://www.nature.com/articles/s41561-023-01131-4 #Antarctic #SeaLevelRise
I view anything I share on any social site as ephemeral, meaning where I can, I set auto delete at 30 days, and also don’t mind if a service goes belly up. Anything worth keeping always lives on my blog.
As the physical environment continues to destabilise in many places any business (or individual) that is able to achieve location independence will be more resilient. #adaptation
#CycloneFreddy is now over land in Mozambique… check the amount of water it is dropping 😳 … (in mm’s) image
As #CycloneFreddy moves into the Mozambique Channel it will have sufficient rocket fuel in 29°C ocean temperatures to develop considerable power. (26.5°C SST is considered the minimum threshold to develop into a significant storm) We wait to see how quickly it gains power before arriving on the Mozambican coast. (Pictured SST in the Mozambique Channel) image
The first reports are in from Madagascar after Cyclone Freddy made landfall late Tuesday. Interesting that they refer to locals placing sandbags on the roofs of their dwellings before the storm arrives and it seemed to have minimised the damage in many cases. In this clip you can see the sandbags holding up under the 130km/h wind: https://nitter.moomoo.me/HurricaneForec/status/1628199975493533701#m #CycloneFreddy #Mananjary #Madagascar
The water level of #LakeGarda Italy’s largest lake (370km2) is under pressure from weeks of dry winter weather and the Alps having only received less than 1/2 of its usual snowfall. Water level records have been kept since 1950. The graph shows a red line (maximum), a green line (average) and a yellow line (minimum) to give context to where the levels are today which 44.90cm Italy is bracing itself for another water scarce summer (See https://www.reuters.com/world/europe/italy-faces-new-drought-alert-after-another-dry-winter-2023-02-20/) The Copernicus Sentinel 2 🛰️ got this image of Isola San Biagio — the island that is no longer an island (See https://nitter.lacontrevoie.fr/CopernicusEU/status/1627942812405665792) Water is becoming a major issue in many parts of the world as we continue to heat. image