
What are the best ways to reliably store a small encrypted blob of data for later retrieval not on your own hardware and not on chain?


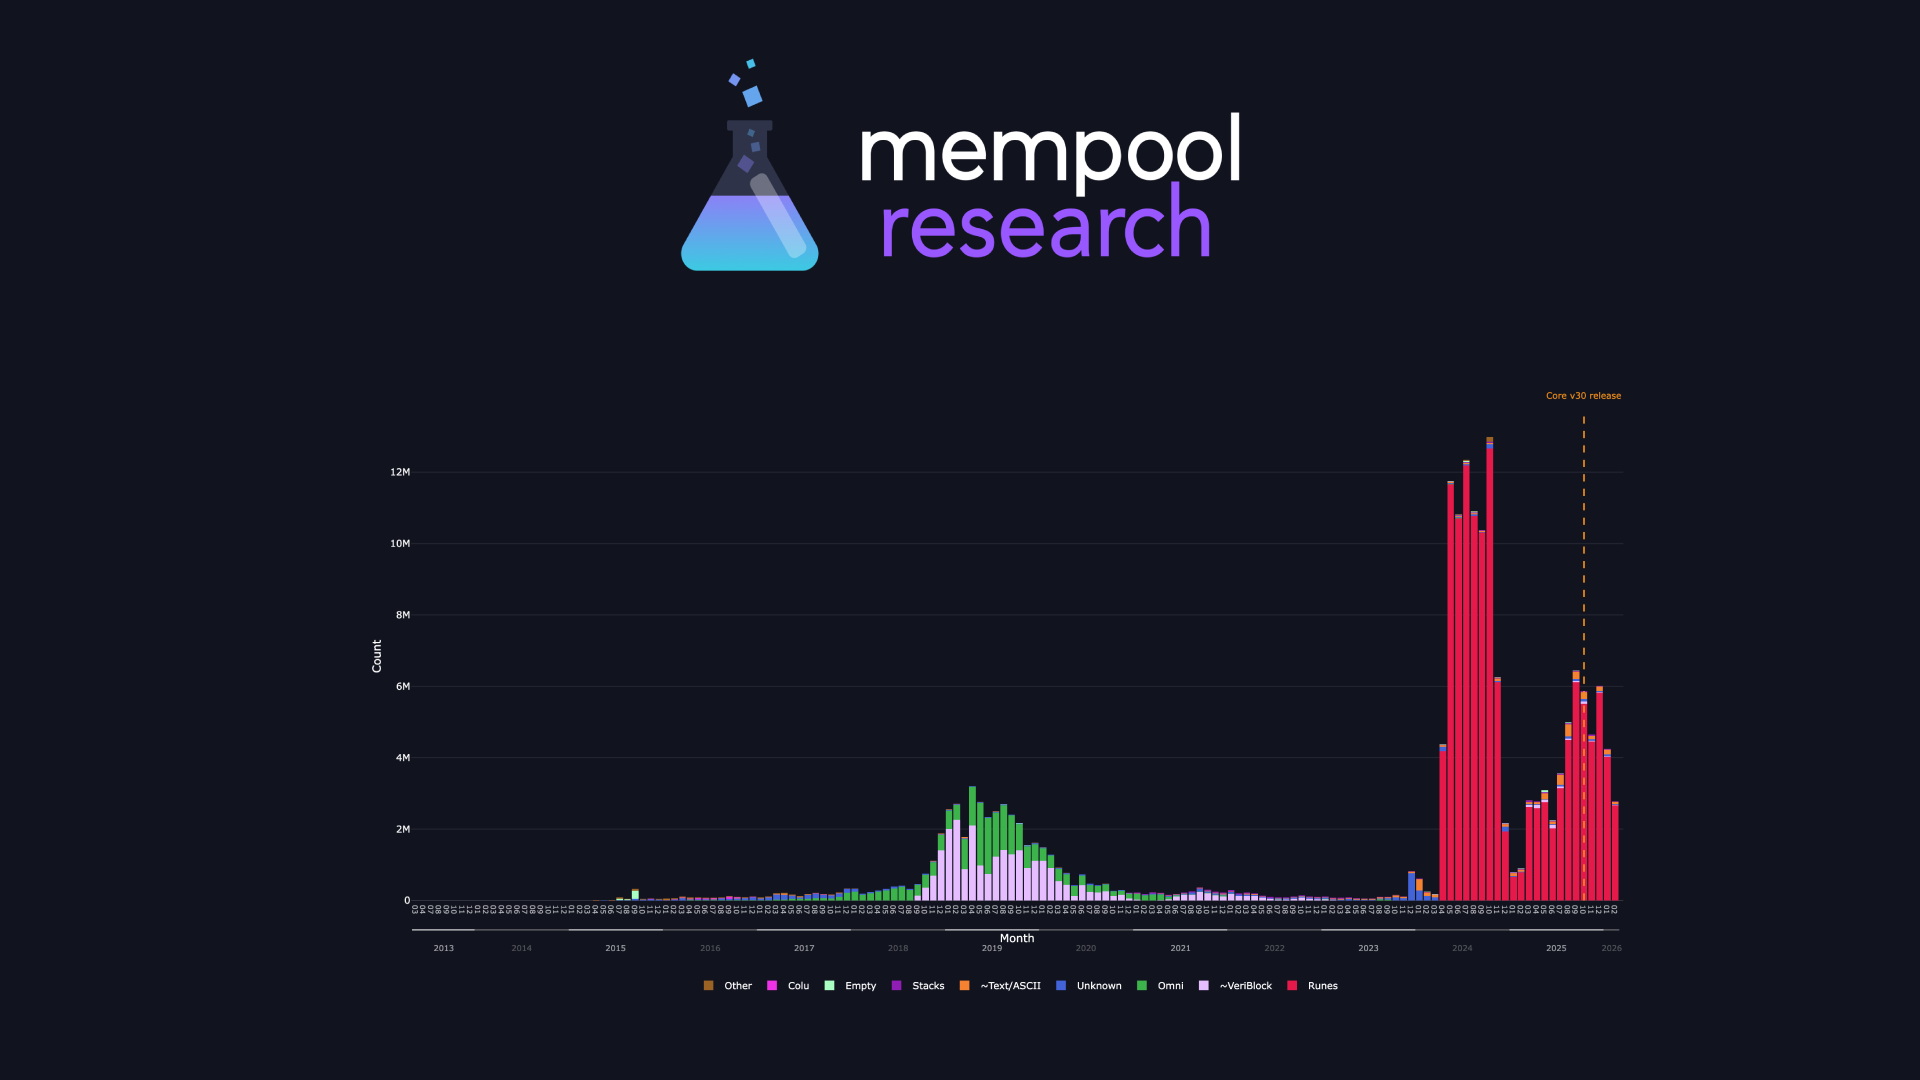
 The 2019 Veriblock wave actually put more data on-chain than anything since. People talk about recent OP_RETURN usage like it's unprecedented, but surprisingly it isn't.
 The important thing is that the spikes in nonstandard OP_RETURNs were in Mar 2024, May 2025, Aug 2025. All before v30 shipped in November 2025. The rate hasn't gone up since. At all. In fact it's come down
 Runes transactions were standard under the old rules and would even still be standard for #BIP110 (the proposal that's supposedly aims to curb data embedding). If these guys are serious about stopping data they should block runes.
 TL;DR: v30 recognised what was already occasionally happening on-chain. Nonstandard OP_RETURNs are vanishingly rare, haven't increased post-v30, and the current wave is already cooling off. The data doesn't support the panic.
Read the full report linked below 👇
TL;DR: v30 recognised what was already occasionally happening on-chain. Nonstandard OP_RETURNs are vanishingly rare, haven't increased post-v30, and the current wave is already cooling off. The data doesn't support the panic.
Read the full report linked below 👇


 If we plot the actual data, we see spikes around round feerates (1,2,3,4 sat/vB) and a (surprisingly ?) large spike in the sub 1 sat/vB fee rates on the right hand side.
 We can animate this graph with a 1000 block sliding window for the month of August.
There is a wide range in the proportion of blocks which are < 1 sat/vB, but the 144 block rolling average has been on an uptrend in recent months (shown here is data since June, block 900000)
We can animate this graph with a 1000 block sliding window for the month of August.
There is a wide range in the proportion of blocks which are < 1 sat/vB, but the 144 block rolling average has been on an uptrend in recent months (shown here is data since June, block 900000)


