
The Macro Dashboard Weekly — week ending 2026-05-22
Summary:
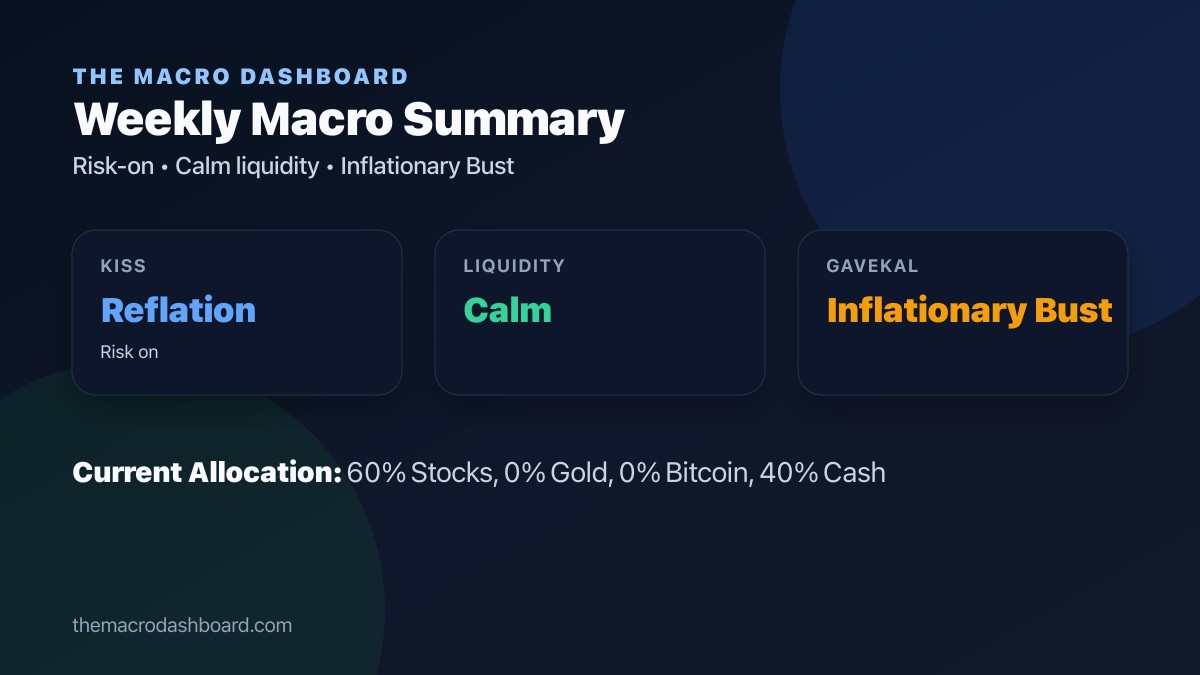
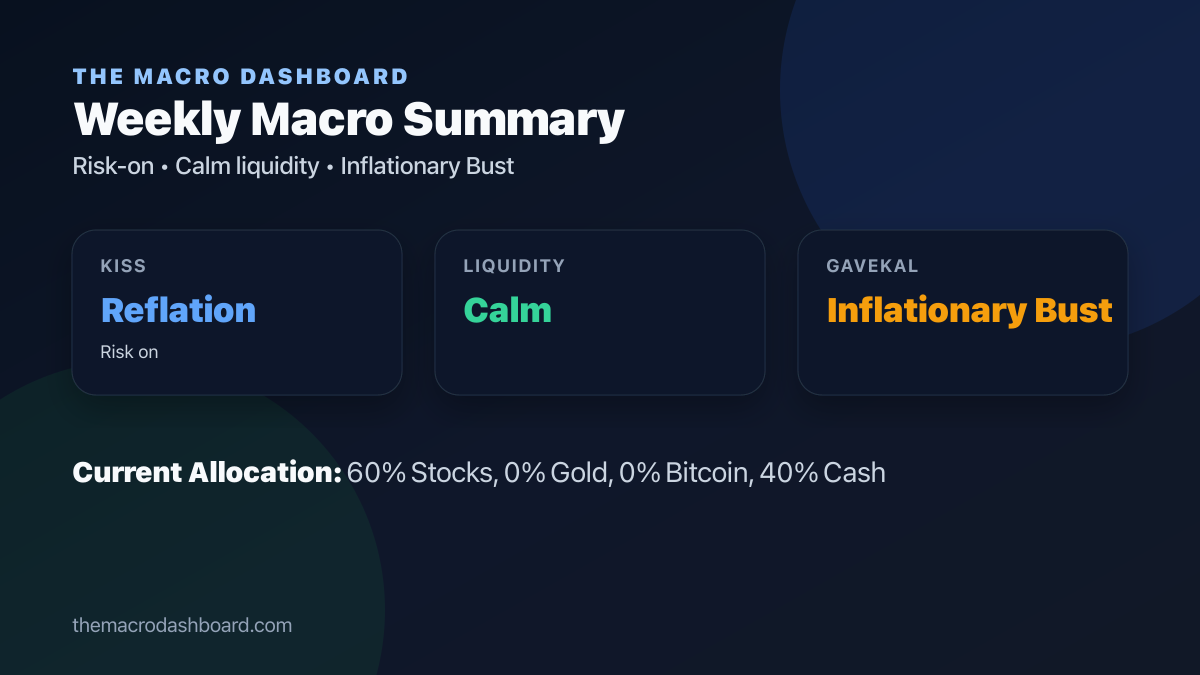
The public macro dashboard currently shows Reflation as the leading KISS market regime with a Risk-on bias. Liquidity is in a Calm cycle with a Calm nowcast, while the Gavekal framework is in Inflationary Bust.
KISS context:
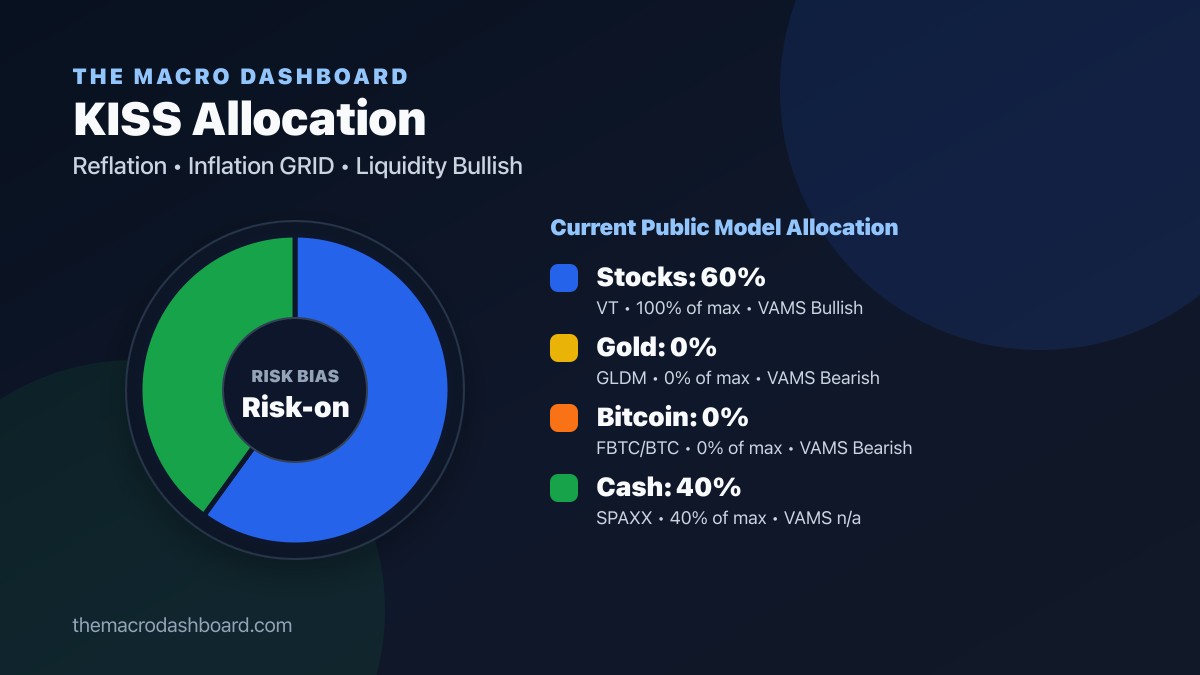
- Regime: Reflation (Risk-on)
- GRID: Reflation
- Liquidity input: Bullish
- Current public model stance: Stocks 60%, Gold 0%, Bitcoin 5%, Cash 35%.
- Allocation-change alerts are posted by the KISS account:  This weekly account is for broader macro context, discussion, and replies. Follow the KISS account if you only want confirmed allocation updates.
Liquidity Cycle:
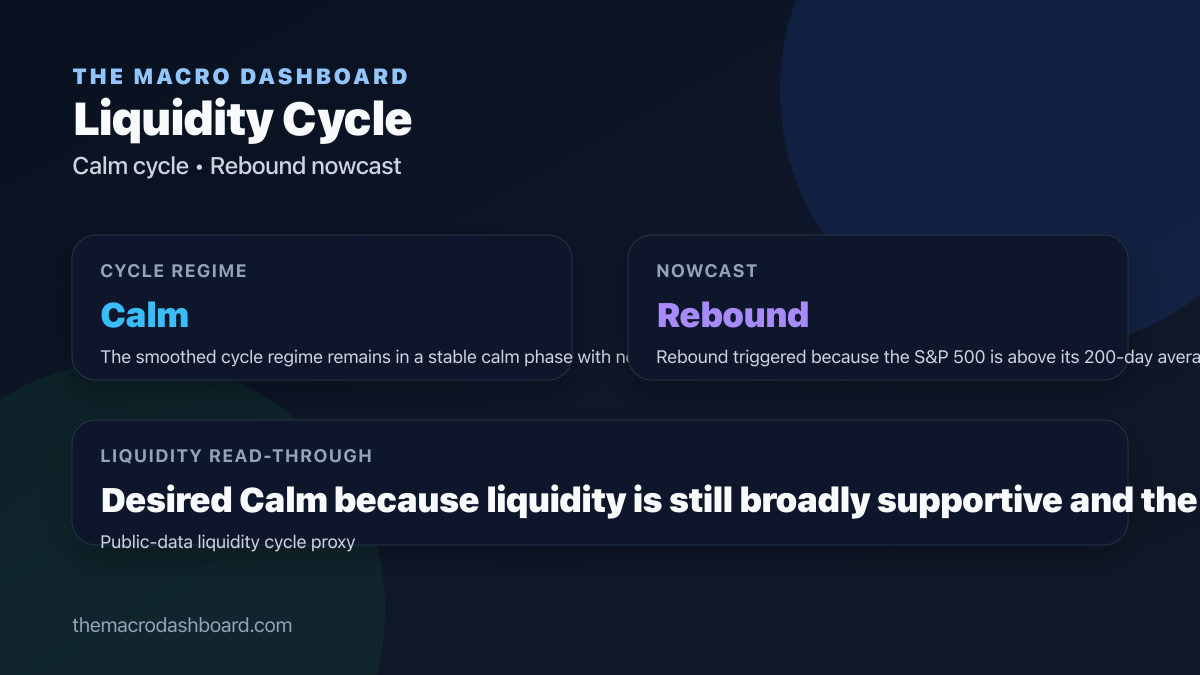
- Cycle regime: Calm
- Nowcast: Calm
- Read-through: The smoothed cycle regime remains in a stable calm phase with no persistent transition signal yet.
Gavekal Regime:
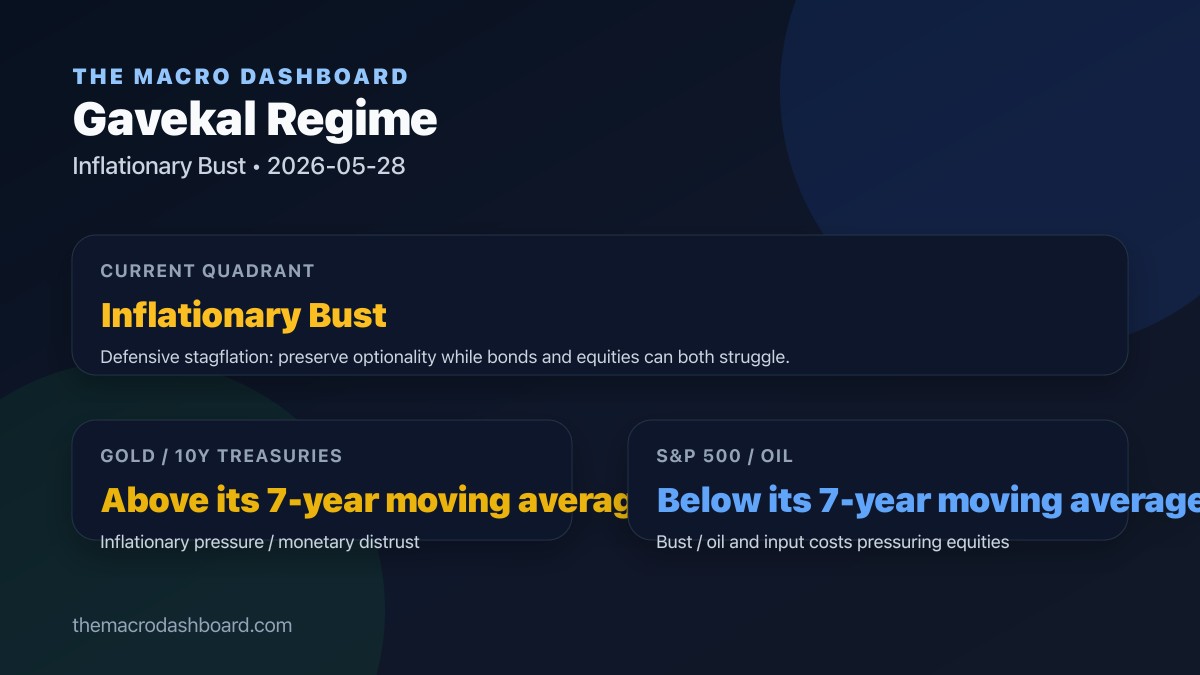
- Quadrant: Inflationary Bust
- Inflation ratio: Gold / 10Y Treasuries is above its 7-year moving average.
- Growth ratio: S&P 500 / Oil is below its 7-year moving average.
Notable changes this week:
- KISS liquidity input: Neutral -> Bullish.
- Liquidity nowcast: Speculation -> Calm.
Chart:
This weekly account is for broader macro context, discussion, and replies. Follow the KISS account if you only want confirmed allocation updates.
Liquidity Cycle:
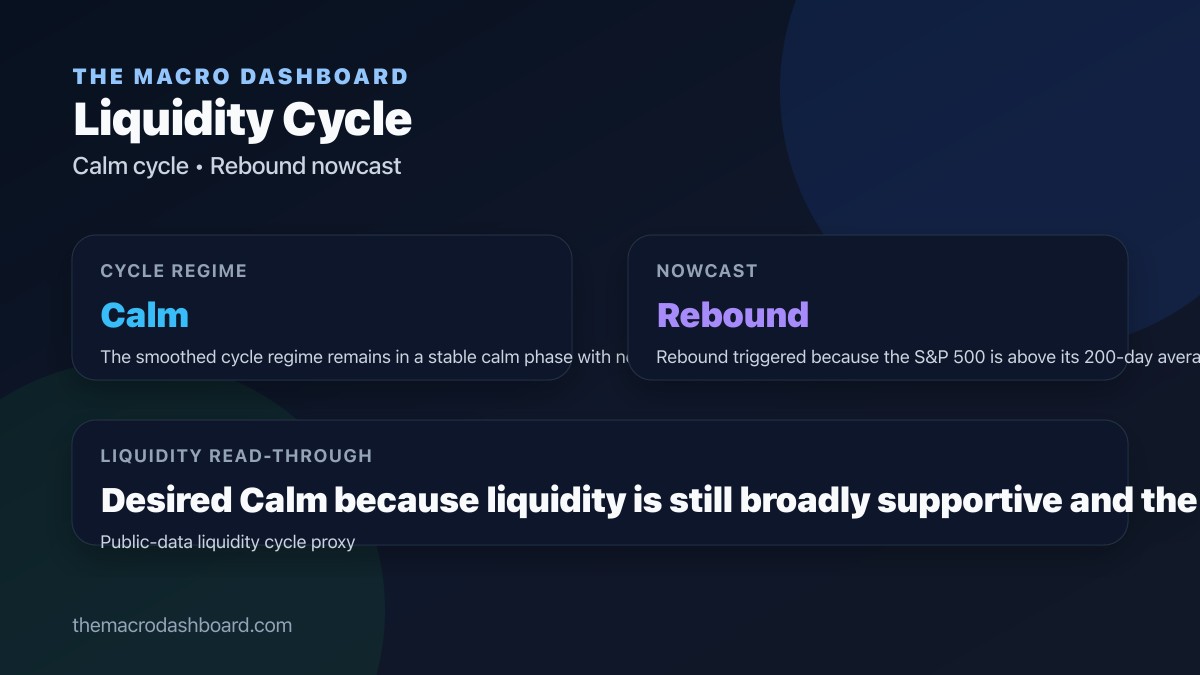
- Cycle regime: Calm
- Nowcast: Calm
- Read-through: The smoothed cycle regime remains in a stable calm phase with no persistent transition signal yet.
Gavekal Regime:
- Quadrant: Inflationary Bust
- Inflation ratio: Gold / 10Y Treasuries is above its 7-year moving average.
- Growth ratio: S&P 500 / Oil is below its 7-year moving average.
Notable changes this week:
- KISS liquidity input: Neutral -> Bullish.
- Liquidity nowcast: Speculation -> Calm.
Chart:
 Dashboards:
 Public dashboard summary only. Not investment advice.
The Macro Dashboard - KISS
Public KISS model allocation change alerts from The Macro Dashboard. Posts only when model allocations change.
Dashboards:
The Macro Dashboard
The Macro Dashboard | Public Macro Signals
Track public-data macro signals for portfolio allocation, liquidity-cycle risk, and Gavekal-style regime analysis in one dashboard.
The Macro Dashboard
Portfolio Signals | The Macro Dashboard
Review dynamic portfolio allocation signals built from public market momentum, growth, inflation, liquidity, and risk-regime data.
The Macro Dashboard
Liquidity Cycle | The Macro Dashboard
Monitor the public-data liquidity-cycle nowcast, including funding stress, market plumbing signals, and regime transition warnings.
The Macro Dashboard
Gavekal Regime | The Macro Dashboard
Explore a public-data Gavekal-style regime map using growth and inflation proxy ratios to classify the current market quadrant.

 Dashboards: