Peter du Toit's avatar
Peter du Toit
peterdutoit@peterdutoit.com
npub144ed...urkq
I speak about climate futures, mitigation and adaptation in the face of the climate crisis. 🇿🇦
Good people of Nostr… All I can say about this, is, if this Sea Surface Temperature doesn’t dip down soon, then what is already set to be an unprecedented 2023/24 is going to be *off the charts* unprecedented. We are literally in uncharted territory. #ClimateLiteracy #ElNino #SST image
Record breaking heat projected for #Portugal and #Spain this week. The northern hemisphere spring started with heatwaves in Asia and now possibly in Europe. #HeatWave image
Using the combined data from 50 satellite surveys of Antarctica and Greenland to determine their rate of ice melting scientists found that Earth’s polar ice sheets lost 7,560 billion tonnes of ice between 1992 and 2020. “The polar ice sheets have together lost ice in every year of the satellite record, and the seven highest melting years have occurred in the past decade.” “After a decade of work we are finally at the stage where we can continuously update our assessments of ice sheet mass balance as there are enough satellites in space monitoring them, which means that people can make use of our findings immediately.”—Prof Andrew Shepherd, Northumbria University Melt acceleration is now well documented. #SeaLevelRise
I have been watching the conversation around this topic from the sidelines but I think something is being missed as highlighted here by Jack two months ago :) Reposts AND/OR zaps are what can replace likes. If you can’t zap for whatever reason you can still repost, quote (or comment) That little extra effort makes it more valuable. For me a “like” has always felt so lightweight that they are almost meaningless. 🤔 #OnlyZaps View quoted note →
The latest EEI data release (April 17, 2023) gives us a clearer view of the impacts of the energy imbalance (link to data in comments) “Schematic overview on the central role of the Earth heat inventory and its linkage to anthropogenic emissions, the Earth energy imbalance, change in the Earth system, and implications for ecosystems and human systems. “The Earth heat inventory plays a central role for climate change monitoring as it provides information on the absolute value of the Earth energy imbalance, the total Earth system heat gain, and how much and where heat is stored in the different Earth system components. Examples of associated global-scale changes in the Earth system as assessed in Gulev et al. (2021) are drawn, together with major implications for the ecosystem and human systems (IPCC, 2022b). “Upward arrows indicate increasing change, downward arrows indicate decreasing change, and turning arrows indicate change in both directions. “The percentages for heat stored in the Earth system components are provided over the period 2006–2020.” image
Location independence, that is the ability for a team to be able to work from anywhere, in a well designed office-in-the-cloud, is going to become a major adaptation strategy for a world where physical environments become increasingly unstable. For example, the flash flooding in Fort Lauderdale this week is projected to become the new norm as we continue to heat. One-day downpours have “increased in frequency and magnitude in the area over the last few decades. These heavy rainfall events coupled with sea level rise on the Florida coast need to serve as significant ‘wake up calls’ for the residents of South Florida about the severe risks that climate change poses to them.”—Prof Jason Furtado University of Oklahoma meteorology (See https://apnews.com/article/downpour-flood-fort-lauderdale-climate-change-7b58c3737086207d30a8370261863847) So it’s great to see that young companies are embracing flexible and location independent working as it means they will be more resilient from the get go. Image source: https://www.flex.scoopforwork.com/company-founding-year image
For the longest time wet bulb temperatures of 35°C and above were considered to be the human survivability threshold. However a new study, who’s goal was to help people better prepare for heat waves found that the threshold was lower. (See https://journals.physiology.org/doi/full/10.1152/japplphysiol.00738.2021) After analyzing their data, the researchers found that critical wet-bulb temperatures ranged from 25°C to 28°C in hot-dry environments and from 30°C to 31°C in warm-humid environments — all lower than the long-held 35°C wet-bulb theory. “Our results suggest that in humid parts of the world, we should start to get concerned — even about young, healthy people — when it's above 31 degrees wet-bulb temperature.”—W. Larry Kenney, professor of physiology and kinesiology and Marie Underhill Noll Chair in Human Performance. This is of particular interest to people living in the equatorial belt as we continue to heat. #ClimateLiteracy #WetBulbTemeratures
How climate literacy should inform business decisions. In May of 2014 various climate models projected a major El Niño event on the horizon, the full onset was only later in 2014, dissipating in May-June 2016. (See https://en.m.wikipedia.org/wiki/2014–2016_El_Niño_event) The impact of this strong El Niño in our part of the world led to a severe water crisis in the City of Cape Town for example, with dam levels beginning to decrease rapidly in 2015. Cape Town’s Water Day Zero came very close. (See https://en.m.wikipedia.org/wiki/Cape_Town_water_crisis) The water crisis had a significant impact on businesses in the area, especially those that rely heavily on water, such as agriculture, tourism, and hospitality. Some of the observed impacts included: 🍇 Reduced agricultural production and income, leading to job losses and food insecurity. ✈️ Reduced tourist arrivals and spending, affecting hotels, restaurants, and attractions. 💵 Increased operational costs and risks for businesses due to water tariffs, restrictions, and shortages. 📈 Reduced consumer spending and confidence due to higher living costs and uncertainty. 💹 Reduced investment and economic growth due to lower business confidence and competitiveness. 
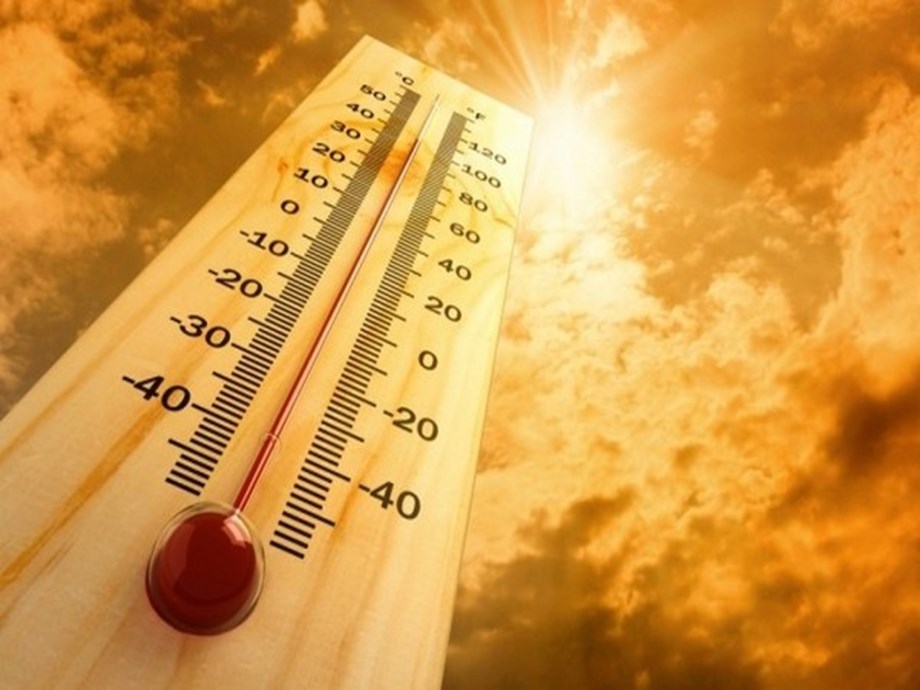
Now we face another El Niño but this time with the backdrop of a planet that has warmed by another 0.2°C since 2014/16. This may not sound like much but these 0.2°C means that extreme events onto us to grow in intensity. If you are in the Cape Town or Western Cape in general how are you planning for an event that are set to rival the conditions experienced in 2017? How will the El Niño affect the area you are in? Do you know? #climateliteracy #climatecrisis #leadership #adaptation image
Copernicus ECMWF data for March 2023. (https://climate.copernicus.eu/surface-air-temperature-march-2023) One month does not a trend make however we are moving ever closer to being permanently above the 1.5° mark. March 2023, now joins the Marches of 2016 (hottest year on record), 2017, 2019 and 2020 all of which were above 1.5° The projection for the year is that we will end at about 1.3° above preindustrial but it is still early days. 2024 will however be an entirely different story even with a weak El Niño. Reminder from the latest AR6 Synthesis Report: “Climate-related risks for natural and human systems are higher for global warming of 1.5°C than at present (1.1°C) but lower than at 2°C (high confidence). Climate-related risks to health, livelihoods, food security, water supply, human security, and economic growth are projected to increase with global warming of 1.5°C. In terrestrial ecosystems, 3–14% of the tens of thousands of species assessed will likely face a very high risk of extinction at a GWL of 1.5°C. Coral reefs are projected to decline by a further 70–90% at 1.5°C of global warming (high confidence). At this GWL, many low-elevation and small glaciers around the world would lose most of their mass or disappear within decades to centuries (high confidence). Regions at disproportionately higher risk include Arctic ecosystems, dryland regions, small island development states and Least Developed Countries (high confidence).” image
The team at Copernicus ECMWF (European Centre for Medium-Range Weather Forecasts) has just published a Climate Change Services dashboard. The more of these data points that are made publicly available the better everyone can get at developing adaptation strategies as we continue to heat. Check it out here:
Don’t be caught off guard. The instruments we use to measure the natural world have been sending back data as pictured. As a result of these changes we are beginning to feel the impacts as projected by the models. For example, as the 2023 European summer gets underway: In southern European countries such as Portugal, Spain and Italy, the severe drought and scarce rain are forcing water restrictions. In these countries there is a call on citizens to limit water use to the bare minimum. In Italy, the government has declared a national drought emergency in several regions of the country. Drinking water in these regions is becoming scarce, forests are prone to burning and there has been observed glacier melt in the Dolomites (https://www.dw.com/en/water-scarcity-eu-countries-forced-to-restrict-drinking-water-access/a-62363819) In Germany, low water levels affected the inland shipping operations on the Upper and Middle Rhine in 2022. The German Farmers’ Association has issued a harvest warning for 2023, saying that without imminent rain, this year’s harvests could be severely affected by projected late-summer heat waves. In France, four departments are already subject to restrictions as of March 1, 2023: Ain, Isère, Bouches-du-Rhône and the Pyrénées-Orientales. Residents of these areas are forbidden to water their gardens, fill their pools or wash their cars. France’s nuclear power plants, which rely on water for cooling, had to reduce their output due to the heat last year and are projecting the same challenges this summer (See https://www.bloomberg.com/news/articles/2022-08-03/edf-to-curb-nuclear-output-as-french-energy-crisis-worsens) Adaptation to this “new normal” should be high on the agenda.