New ring on the interface:
LAST 24 HOURS OF BLOCKS!
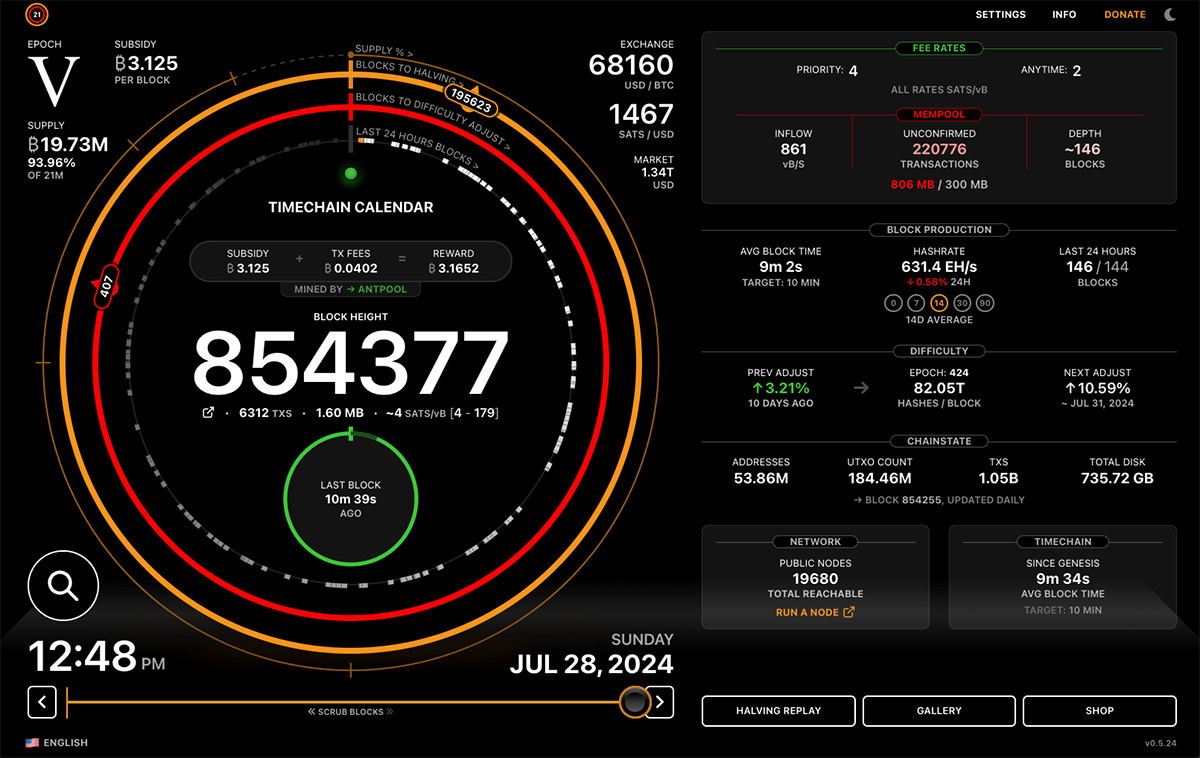
A live visualization of the last 24 hours of block production. Each block is positioned on the ring based on the exact timestamp it was mined. Now you can SEE the pace of blocks, clusters & gaps, on this rolling 24 hour span.
To compliment this, there is a running count of the last 24hrs of blocks. 144 blocks is the target 10 minute average over this period. Now you can compare the last 24hr pace with the Avg Block Time that’s tracking the pace of blocks for the entire difficulty period (red ring).
Look at that! As far as I'm aware the only way to easily and beautifully visualize when the blocks were mined.
(Amoung many other great info too)
View quoted note →
Try a fresh load . A lot changed in this version. Also check the complete url. Let me know what that looks like if you get the same result in a fresh load.
I still cannot view your capture. Please tell me the device. I have found a couple bugs and am fixing now. Will have an updated release w some fixes later this evening…
This is sick, just bookmarked!
Slight Nit (and someone pls correct me if I’m wrong):
Difficulty is not really measured in hashes/block, it’s just a magic number. If you multiply Difficulty * 2^32, that would theoretically give you the statistical avg number of hashes required to find a block... but even then, only based on the previous Difficulty Epoch (it’s a lagging stat).
I only mention cause you’re going out of your way to give units and context, which is 🔥
I understand. Maybe it’s a notation thing. I’m trying to say how many hashes to find a block but haven’t found a better way to express that as a short label in the ui. Open to suggestions. Maybe just “hashes”?