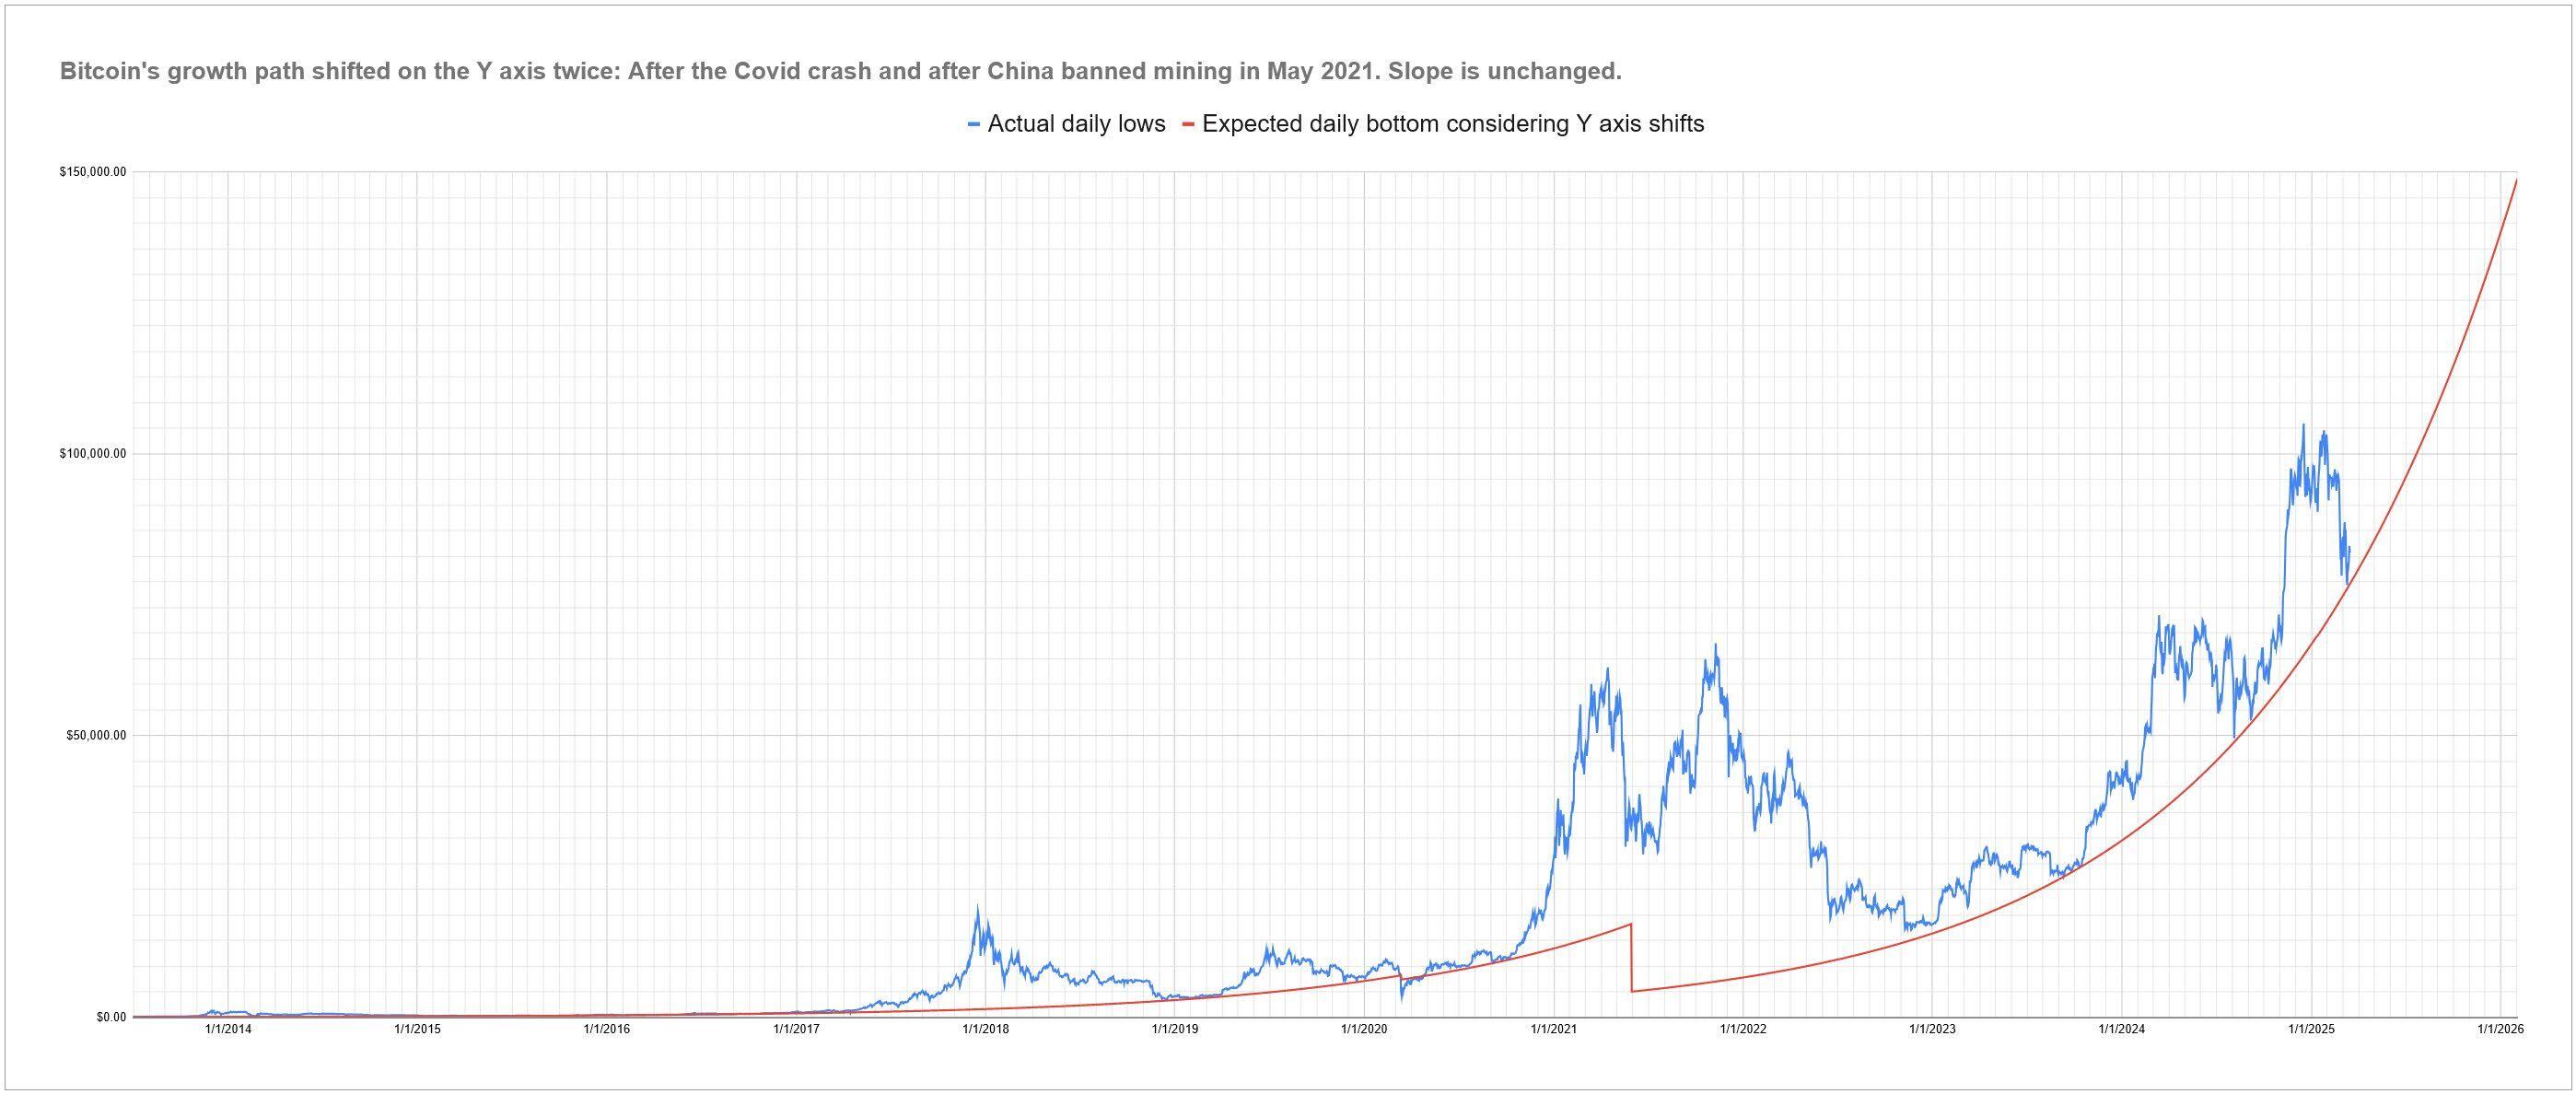
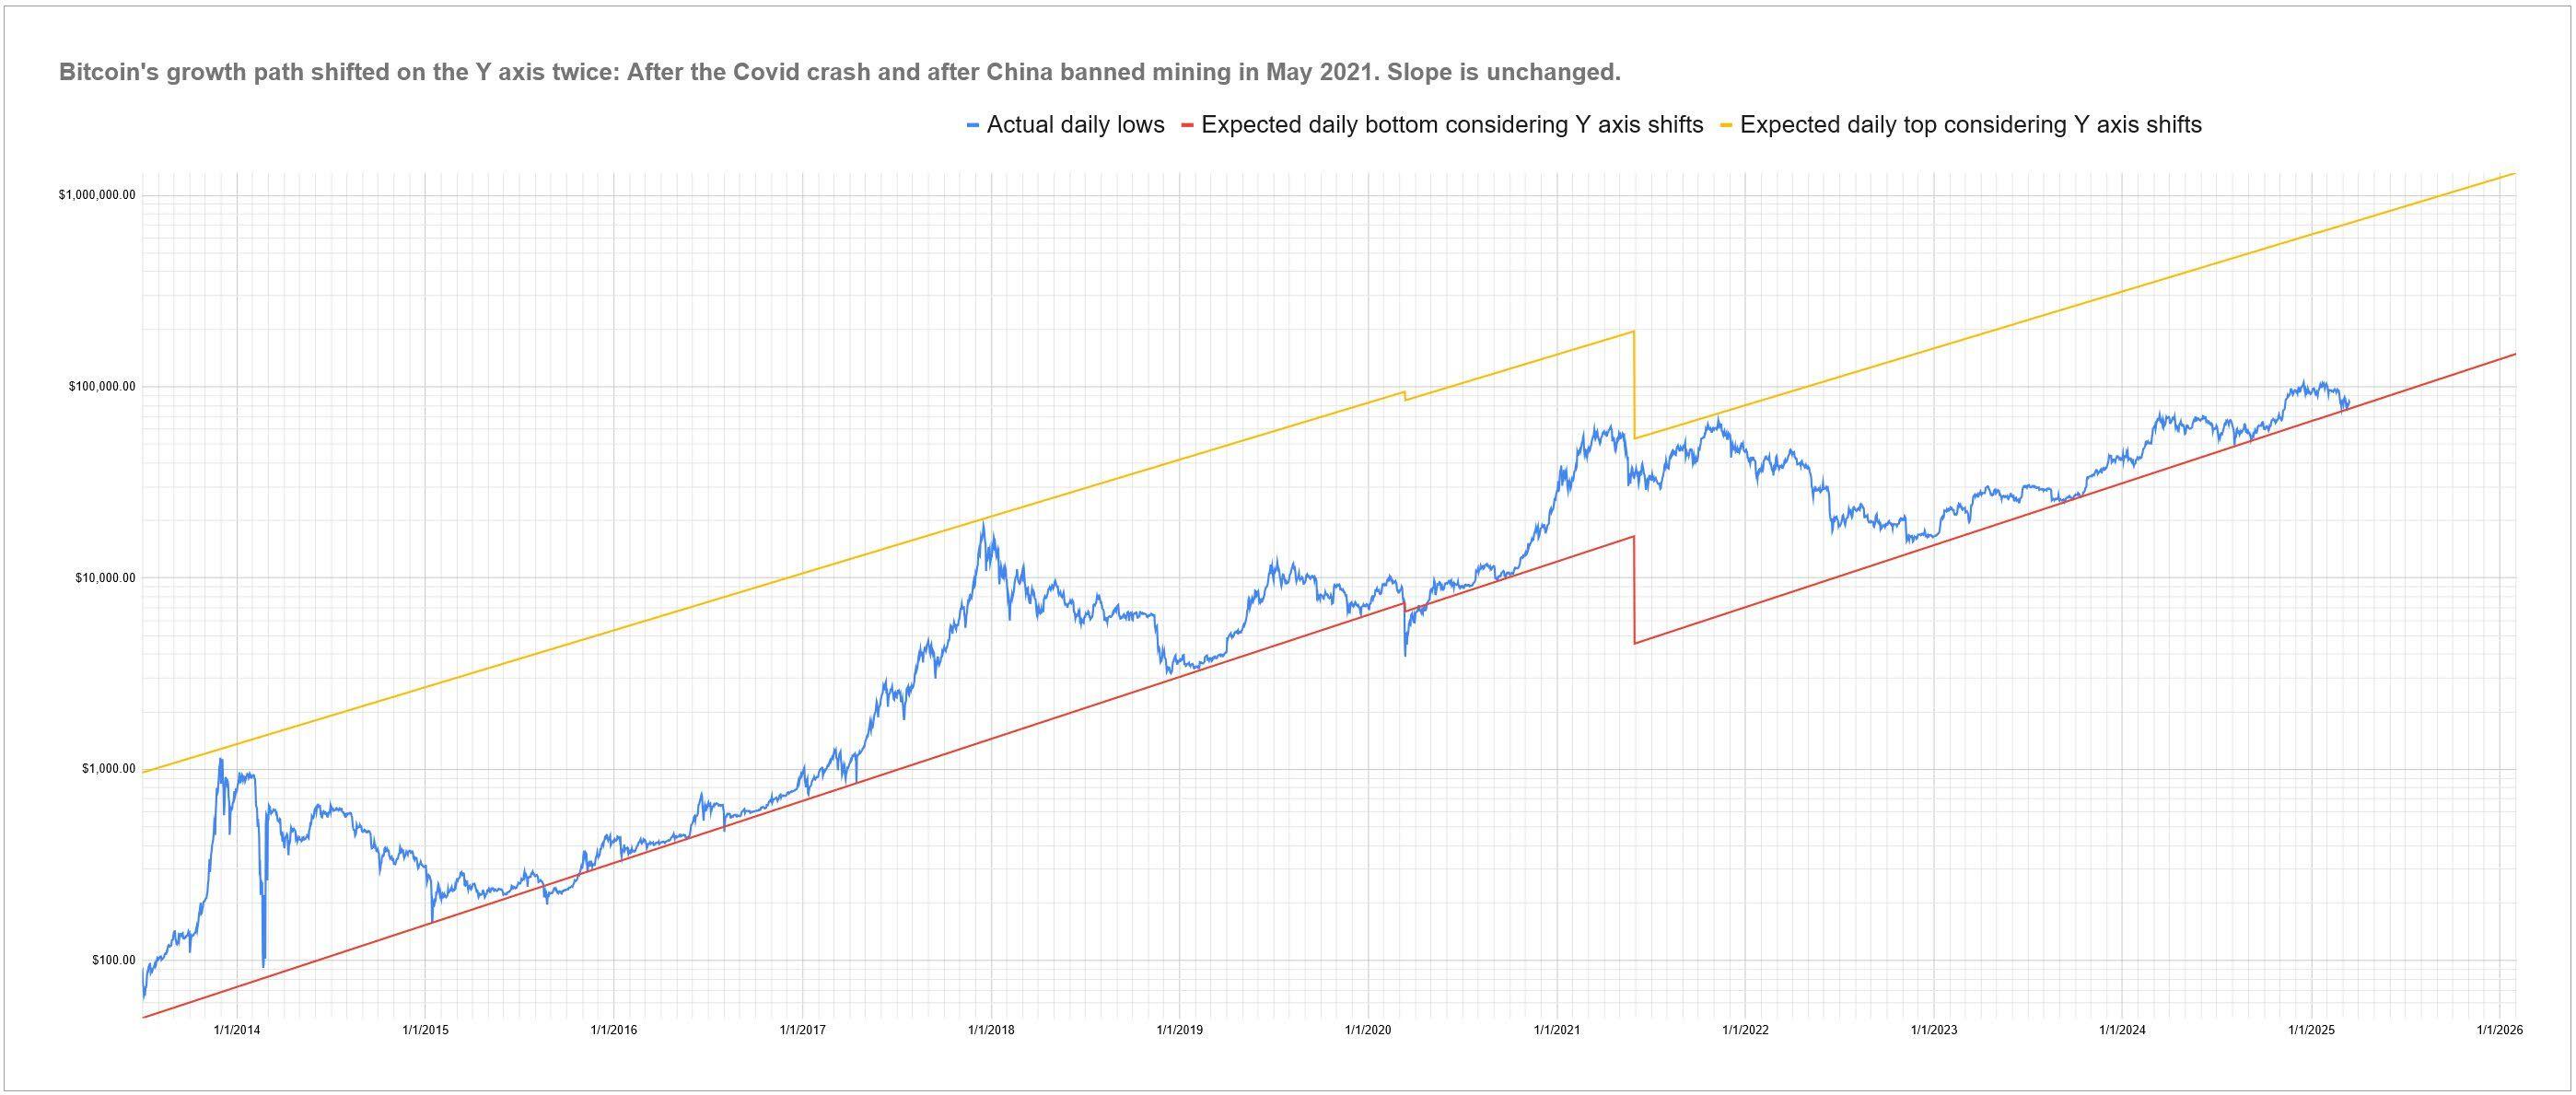
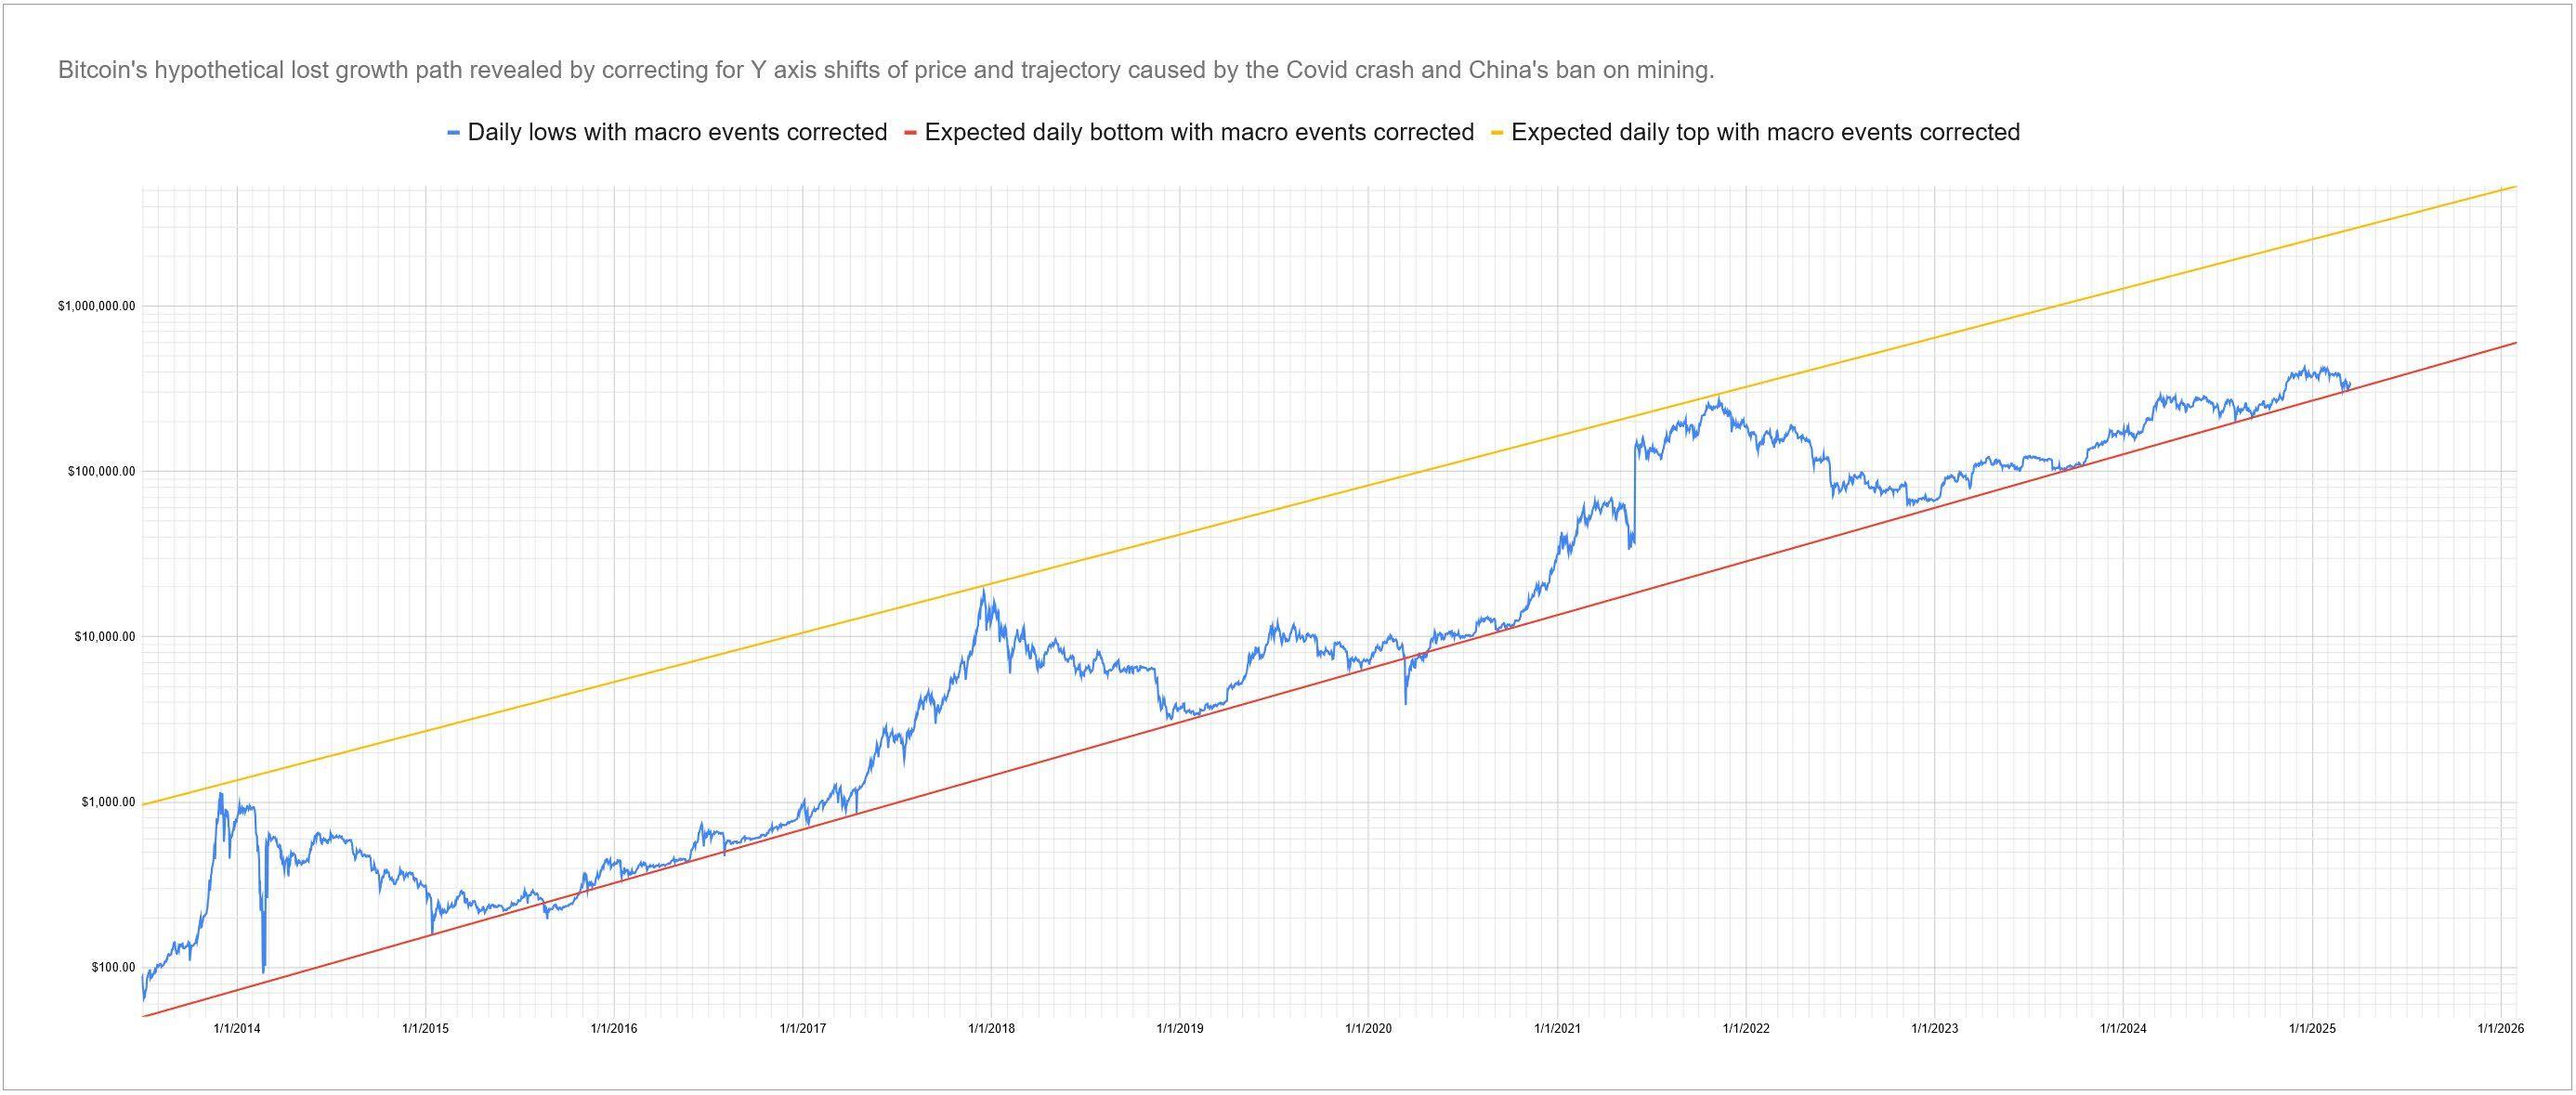
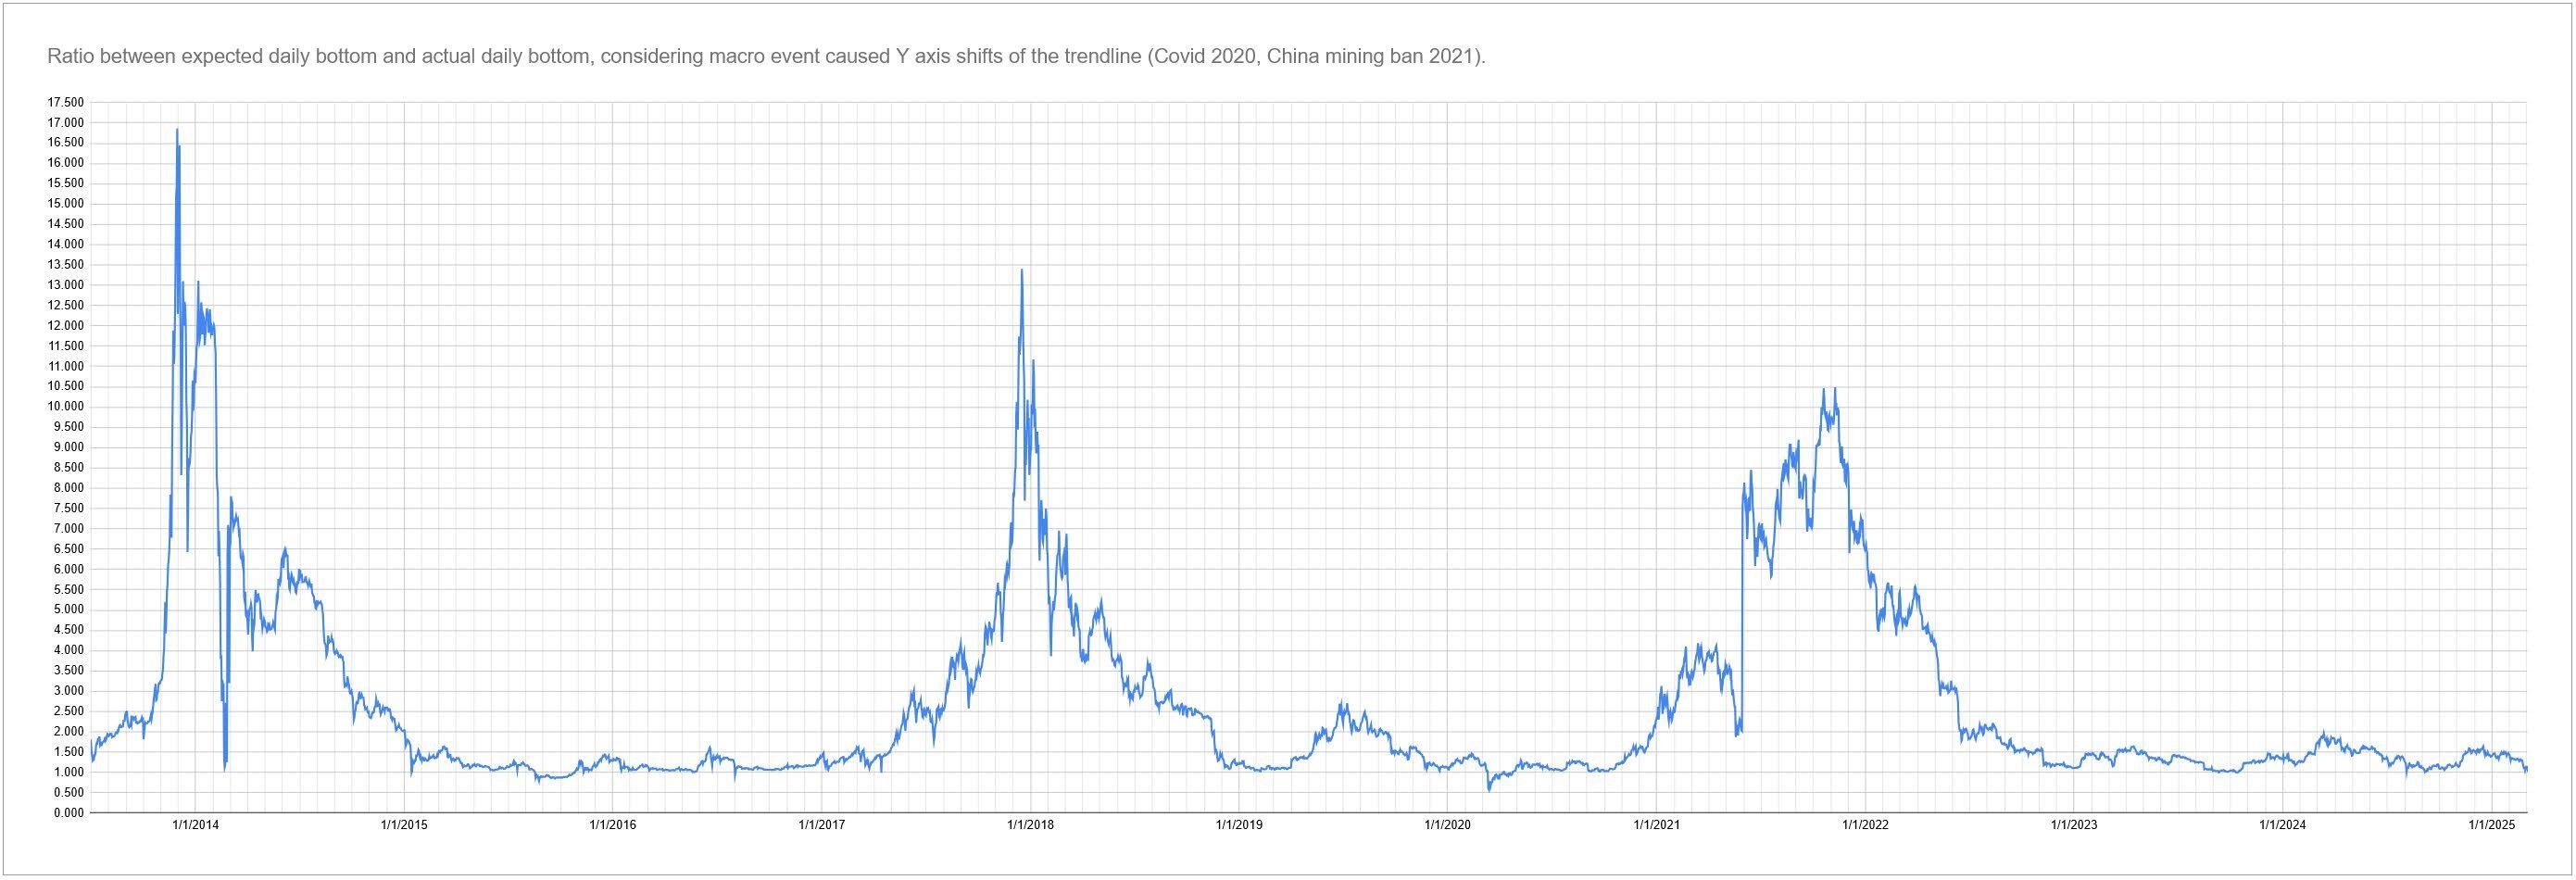
We hit bottom yesterday, hitting 1.007 times my calculated bottom of the trendline. Save this post for future reference, without a major unforseen global macro event that lowers the trend's position on the Y axis, on the path to a sustainable $1,000,000 #Bitcoin we will never drop below the following prices after the corresponding dates:
Today - $76k
04/05/2025 - $80k
06/02/2025 - $90k
07/23/2025 - $100k
10/20/2025 - $120k
02/07/2026 - $150k
06/27/2026 - $200k
10/15/2026 - $250k
(This cycle's Bear bottom)
01/12/2027 - $300k
03/28/2027 - $350k
06/02/2027 - $400k
07/29/2027 - $450k
09/19/2027 - $500k
12/17/2027 - $600k
03/01/2028 - $700k
05/06/2028 - $800k
07/02/2028 - $900k
08/23/2028 - $1m
We may hit $1m this year briefly, but it won't be sustainable and we will return to the overall trendline.
☮️🧡₿
Login to reply
Replies (10)
Very specific predictions. Time will tell I suppose.
Bookmarked just for fun.
Bullish. Reposted for posterity.
View quoted note →
Big if true.
Make a chart for data like this 😩🤌
The weird dates give me no sense of the date
Also, big of true
Also, big of trueI really respect that you're willing to put price predictions and timelines out there
Mathematics can be very useful when looking at trends, deducing when is a slightly better time to buy, or sell
But ultimately this is the most useful approach to your post: all models are wrong, some are useful, most are dangerous
Which goes to say, I've become less tolerant of this type of technical analysis, as ultimately, anything can happen
HODL
Current potential bottom is $79,741.07, with the price at $81,321.04 today we're at 1.0198 times the potential bottom. Bitcoin has not fallen below this calculated potential bottom trend line 99.9% of the time since July 1st 2013 with a few exceptions of things for which we need to account and adjust.
This is after adjusting for the 2 large macro events that actually shifted the overall trend line downward on the Y axis, being the COVID shutdown and the China mining ban, as well as also ignoring the temporary mid 2015 exchange glitch that crashed the price for a few months but did not change the trajectory as it's resumed it's course after.
I know this sounds a lot like "it works perfectly! Except when it doesn't", but my personal view is that this simply means the growth rate of Bitcoin cannot be stopped, it can only be delayed. We cannot predict the future considering the unknown macro events that may very well shift the trend down again and delay it further, but I do know what is most likely to happen if macro events like that don't occur based on the historical data.
By April 5th we will have a potential bottom of $80k, with a strong possibility that we'll never go below that again.
By the end of 2028 we will likely see a potential bottom (unlikely to go lower) of $1,000,000 per coin regardless of the current temporary bubble that may touch that price briefly this year before correcting back to the overall trend line about a year later Q4 2026.


We hit bottom yesterday, hitting 1.007 times my calculated bottom of the trendline. Save this post for future reference, without a major unforseen global macro event that lowers the trend's position on the Y axis, on the path to a sustainable $1,000,000 #Bitcoin we will never drop below the following prices after the corresponding dates:
Today - $76k
04/05/2025 - $80k
06/02/2025 - $90k
07/23/2025 - $100k
10/20/2025 - $120k
02/07/2026 - $150k
06/27/2026 - $200k
10/15/2026 - $250k
(This cycle's Bear bottom)
01/12/2027 - $300k
03/28/2027 - $350k
06/02/2027 - $400k
07/29/2027 - $450k
09/19/2027 - $500k
12/17/2027 - $600k
03/01/2028 - $700k
05/06/2028 - $800k
07/02/2028 - $900k
08/23/2028 - $1m
We may hit $1m this year briefly, but it won't be sustainable and we will return to the overall trendline.
☮️🧡₿
View quoted note →
First of many milestones predicted here has been hit.
04/05/2025:
Actual price: $82,774.08
Predicted bottom: $80,000 ($80,067.71 to be precise)
Ratio between price and bottom: 1.0338
99.9% chance we're forever above $80k from now on, unless massive macro events occur that shift the trend line down again.
See y'all in June for the next check in. 🫡
Attached images were made mid March.
☮️🧡₿

We hit bottom yesterday, hitting 1.007 times my calculated bottom of the trendline. Save this post for future reference, without a major unforseen global macro event that lowers the trend's position on the Y axis, on the path to a sustainable $1,000,000 #Bitcoin we will never drop below the following prices after the corresponding dates:
Today - $76k
04/05/2025 - $80k
06/02/2025 - $90k
07/23/2025 - $100k
10/20/2025 - $120k
02/07/2026 - $150k
06/27/2026 - $200k
10/15/2026 - $250k
(This cycle's Bear bottom)
01/12/2027 - $300k
03/28/2027 - $350k
06/02/2027 - $400k
07/29/2027 - $450k
09/19/2027 - $500k
12/17/2027 - $600k
03/01/2028 - $700k
05/06/2028 - $800k
07/02/2028 - $900k
08/23/2028 - $1m
We may hit $1m this year briefly, but it won't be sustainable and we will return to the overall trendline.
☮️🧡₿
View quoted note →
Sorry I didn't reply! I made a new post with the charts included here: nevent1qqs9xgnfcrtlpeh44gf4s6gn335j9lc2rzudp47t5g3qg8z264rlntcppamhxue69uhkummnw3ezumt0d5pzpd7063e0lyp5g8kxe42mk5r0jazzzxnwdrjj2fw5y3z3dx76q066qvzqqqqqqycj7a2v
🖖🫡
That's a lot nicer 😇