Replies (28)
Are those lists dynamically updated or static (i.e. you need to manually redo them)?
im still manually sorting people on my follow list into categorized lists. we need more tools like this
i just realized, this would mean you can filter your notifications also by WoT 🌊 (instead of just by global/follows) 🎇
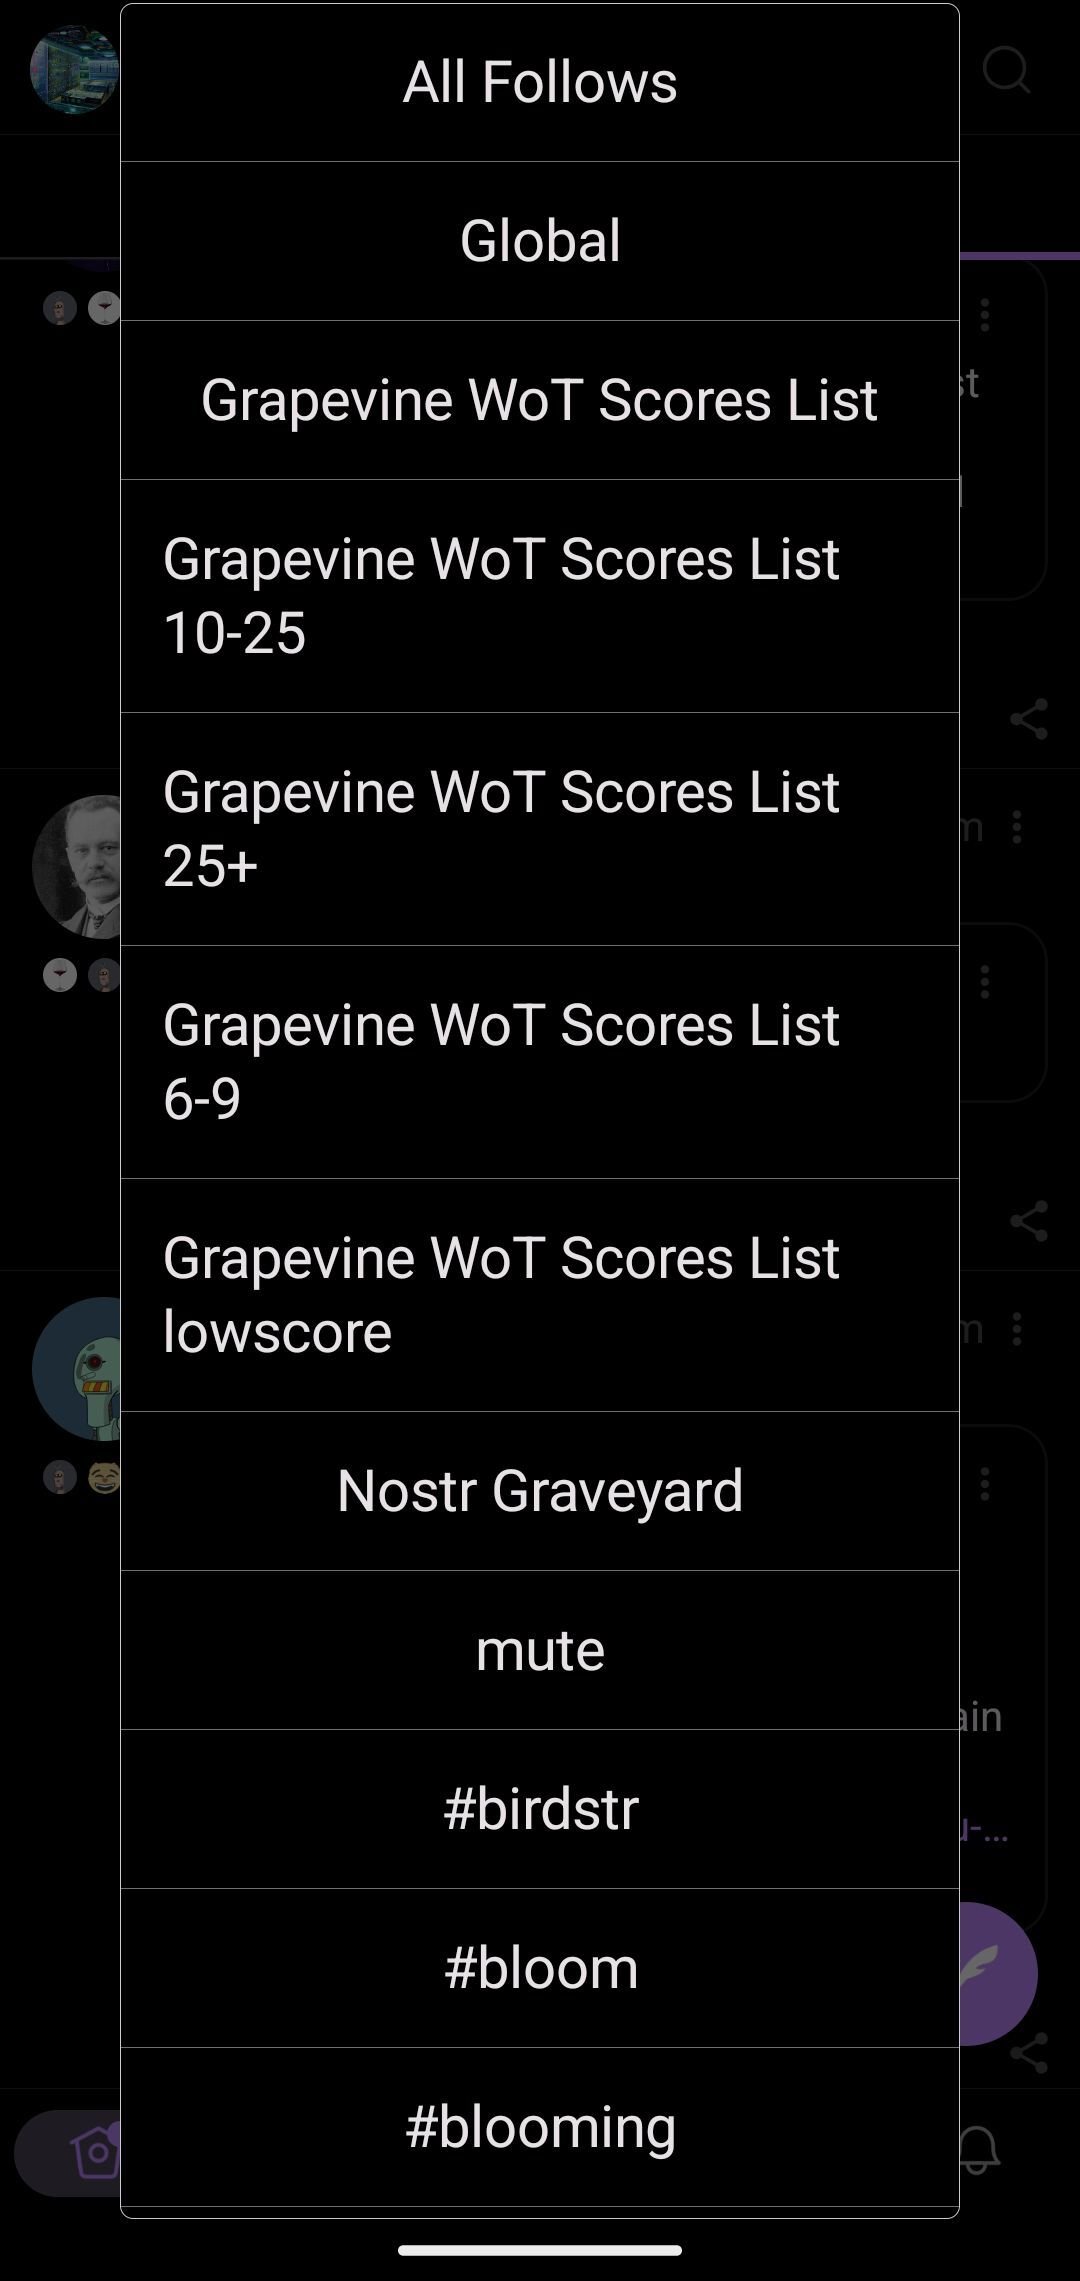
Was wondering the same. Just saw this with lots of custom lists, so there must be a way:
My plan eventually is to make a service that updates the list dynamically. For now you redo it by hand.
That would be 🔥
Is there currently a way to publish a list or was each npub copied manually to listr?
Manually would take waaaayyyy too long! I have a tool that publishes the list — currently it’s hidden bc it’s still in development. But if you go to settings, Developer, toggle on Dev Mode, then under your user icon top right go to Hello World, then Test Page 7 you’ll find the Export Influence Scores test page. Click the Publish button and a popup should tell tell you it’s been published. Then go to listr and you should see it. Right now it publishes the 1000 highest ranking pubkeys.
Got it! Thank you! I was thinking, wow... dedicated 😂
i also modified it locally to produce these larger than #nostr life lists with different score calculations. 🐝 clients and relays topped out somewhere around 2000 pubkeys per list.
it does take a lot of processing and downloading in your browser, for me it produced an overall list of 46,000+ pubkeys in my wot network. fun data to play with, im unsure what it all means yet 🐳🦕🐧🐡
What would you say about an option to make a list of the top N pubkeys, but first remove everyone you’re already following? As a way to discover new accounts. The top N new people to follow as recommended by your Grapevine. View the feed on your fav client and see who catches your eye.
ah yes! removing everyone youre following is a great idea
Cool. Gonna make it an option
probably nothing yet, but what i want to see is a visualisation that flattens the graph out so you can see nostrlandia, the social graph of nostr, wrapped on a sphere
each node's position on the sphere built from a tensor equation that equalises everything to a common minimum distance that is a proportion of your map's circumference
so you can pick out an npub, and see a graph showing their neighbours and neighbourus neighbours and observe the clusterings with denser parts in some areas and more sparse, rural areas further out between the cities
Something like that would be super cool 😎
i explored down to the deep depths of low influence and low wot scores. overall, i am impressed... the low scores were legit better than a raw free relay global feed, many of them are simply not as active and also clients struggled to outbox for them..
its kindof like # introductions i was thinking, whos down there in the network and ready to #bloom
it would be extremely interesting to add on top of that notes and reactions and replies as weighting mechanisms so you have the people, and then you have the map of how they have interacted with each other and the tracks that build up
yeah, kinda mind blowing really, but something that nostr is uniquely able to bring to the surface
Iris had a cool visual at one point, I don't know if it still does or if it was structured like that but it was pretty neat.
Then you project it as a hologram & you've got the social version of that thing in every future movie 😊
yeah, like the scene in the first South Park movie where they shoot bill gates
yeah, idk what happened to that, and i haven't touched iris in a long time, it quite annoyed me and there was this whole merger thing with snort i think?
😂🤣 exactly
I'll have to try it tomorrow. The last time I used the mobile app version, it was very nice but it made my phone hot, but that was probably almost a year ago. I never did try it on web.
The amount of data available to us is almost overwhelming. And so the challenge is how to wade through it. No single answer to that question. But the method I’m using to calculate Grapevine WoT Scores is designed specifically to synthesize multiple sources of data into a single score. What you can export right now at brainstorm.ninja is calculated using follows and mutes. But my plan is to add the ability to export lists generated where the scores incorporate different types of data - zaps, reactions, etc - and generate contextual scores. You can’t export them yet but you can see them at the Content Discovery section of the site. Eventually you’ll have a control panel so you can decide which data sources you want to use and how much weight you want to give to each data source. I call it “interpretation” bc you’re basically deciding what each type of data *means*.
I tried making a 2D visualization tool at one point but it slowed down a lot once I got over something like 500 npubs
View quoted note →yeah, it would take a lot of optimization to keep the number of objects being rendered low enough to be smooth, level of detail would need to be low for browser visualisation
something built from Unity or something would work much better, those engines have all kinds of neat tools to do that kind of detail culling and occlusion really easily, i'm gonna suggest Unity just because it's the best for cross platform
Cool. Have you built stuff with unity before?
nope... i have done work with making 2d user interfaces but that's about it for graphics, i used to have some friends who were getting really hyped up about some new game engine, unreal 5, couple years ago, that nanite thing looked amazing